Geron: One of the Best-Performing Biotech Stocks in Past Month
Geron (GERN) has been one of the best-performing biotechnology companies in the last month, rising 67.1% since August 10.
Sept. 12 2018, Published 9:57 a.m. ET

Geron’s growth trends
Geron (GERN) has been one of the best-performing biotechnology companies in the last month, rising 67.1% since August 10. That’s mainly attributable to the job posting by Johnson & Johnson (JNJ) for a pricing manager that mentioned assisting in the pricing approach for imetelstat as one of the job responsibilities.
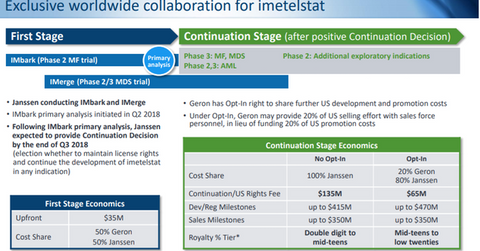
On November 13, 2014, Geron announced a collaboration with Janssen Biotech, a subsidiary of Johnson & Johnson, for the development and commercialization of imetelstat, its investigational telomerase inhibitor across various hematologic malignancies and especially in myelofibrosis (or MF). The deal was back-loaded with an upfront payment of only $35 million and up to $900 million payable to Geron for achieving various regulatory, development, and commercial milestones. Johnson & Johnson’s decision to either continue or terminate the partnership is anticipated in Q3 2018.
Will Johnson & Johnson continue the partnership?
Geron is currently evaluating imetelstat as a second-line therapy for intermediate to high-risk MF patients in IMbark, a Phase 2 trial. The primary analysis of this trial, which will include the impact of the investigational drug on an overall survival metric, is expected to be a key factor in shaping Johnson & Johnson’s decision to continue its partnership with Geron for imetelstat.
Johnson & Johnson is also expected to consider efficacy and safety results from IMerge, an open-label Phase 2 study evaluating imetelstat in relapsed/refractory patients with a low to intermediate risk of myelodysplastic syndrome who are transfusion-dependent and have been previously treated with the erythropoiesis-stimulating agent. With no approved drug, Geron depends excessively on Johnson & Johnson’s decision for its future growth prospects.
Once Johnson & Johnson decides if it will continue, Geron can either decide to opt in or opt out of the imetelstat research program.
In the next part, we’ll look at the growth trends for Exact Sciences.
