Analyzing Alibaba’s Fundamentals
On December 19, Alibaba (BABA) stock opened at $140.75 and closed at $137.14, posting an average volume of 27.24 million.
Dec. 4 2020, Updated 10:52 a.m. ET

Shareholder returns and stock trends
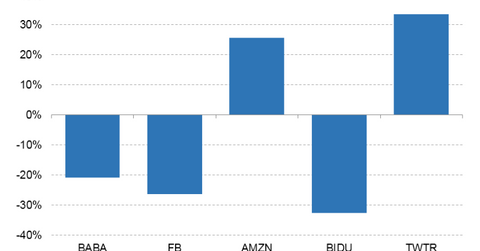
On December 19, Alibaba (BABA) stock opened at $140.75 and closed at $137.14, posting an average volume of 27.24 million. The stock has returned -11.01% in the last month, -20.90% in the last 12 months, and -9.48% in the last five days. Meanwhile, peers Facebook (FB), Amazon (AMZN), Baidu (BIDU), and Twitter (TWTR), have returned -26.31%, 25.58%, -32.56%, and 33.43%, respectively, in the last 12 months.
Relative strength index
Alibaba’s 14-day RSI (relative strength index) score is 43, and Facebook’s, Amazon’s, Baidu’s, and Twitter’s scores are 39, 38, 32, and 50, respectively, indicating that the stocks are neither overbought nor oversold.
Market capitalization
On December 19, Alibaba was the world’s third-largest Internet player, with a market capitalization of $361.41 billion. To compare, Facebook’s was $385.43 billion, Amazon’s was $761.58 billion, Baidu’s was $57.39 billion, and Twitter’s was $25.08 billion.
Moving averages
On December 19, Alibaba was trading 21.61% below its 200-day moving average, while Facebook, Amazon, Baidu, and Twitter were trading 21.99%, 12.33%, 28.87%, and 3.40% below their 200-day moving averages, respectively. Alibaba stock is currently 10.23% below its 20-day moving average and 7.71% below its 50-day moving average.
