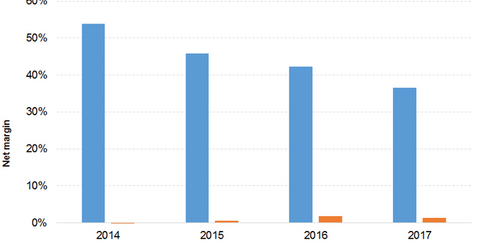
Net Margins for Alibaba and Amazon: A Comparison
Alibaba’s net income remained at 20.1 billion yuan in the quarter ended June 30, 2018, just like the quarter ended in June 2017.
Sept. 26 2018, Updated 10:32 a.m. ET

Analyzing Alibaba’s net margins
Alibaba’s (BABA) net income has grown at a three-year CAGR (compound annual growth rate) of 34% to 83.2 billion yuan in the fiscal year ended March 31, 2018. Higher growth in revenue, gross profit, and income from operations led to the increase in net income.
Its net income growth improved from 23% in 2015 to 44% in 2018. However, its net margin declined from 46% in 2015 to 33% in 2018. Its EPS grew at a three-year CAGR of 33% to 32.9 yuan in the fiscal year ended March 31, 2018. EPS growth improved from 15% in 2015 to 40% in 2018.
Alibaba’s net income remained at 20.1 billion yuan in the quarter ended June 30, 2018, just like the quarter ended June 30, 2017. Revenue growth was affected by lower gross profit growth and a decline in income from operations. Its net margin declined from 40% in the June 2017 quarter to 25% in the June 2018 quarter. EPS improved 1% to 8 yuan in the quarter ended June 30, 2018.
Amazon’s net margins
Amazon’s (AMZN) net income increased at a three-year CAGR of 94% to $2.2 billion in the fiscal year ended December 31, 2017. The gradually improving operating income further supported steady growth in sales and gross profit. Amazon was able to record an impressive increase in operating income for 2015 followed by a 5% decline in 2017. Its net margin improved from 0% in 2014 to 1% in 2017. Its EPS rose 91% to $4.60, posting impressive growth in 2015 followed by a 7% decline in 2017.
Amazon’s net income grew 352% to $4.2 billion in the six months ended June 30, 2018. Impressive growth in sales, gross profit, and operating income drove its net income growth. Its net margin improved from 1% in the six months ended June 30, 2017, to 4% in the six months ended June 30, 2018. Its EPS increased 346% to $8.30 in the six months ended June 30, 2018.
Net income and EPS of peers
JD.com (JD) recorded net income of 5 billion yuan and 1.5 billion yuan in 2017 and the six months ended June 30, 2018, respectively. Its EPS was 3.4 yuan and 1 yuan for the same periods, respectively.
Walmart’s (WMT) net income was $9.9 billion and $1.3 billion in the fiscal year ended January 31, 2018, and the six months ended July 31, 2018, respectively. Its EPS for the same periods was $4.40 and $2.40, respectively.
In the next two parts, we’ll focus on Alibaba’s and Amazon’s valuations.
