A Look at Spectrum’s Financial Position in September
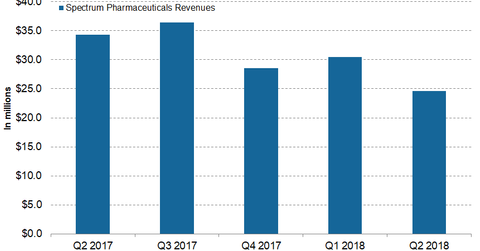
In the second quarter, Spectrum Pharmaceuticals (SPPI) generated net revenues of $24.2 million compared to $34.3 million in Q2 2017.
Aug. 18 2020, Updated 5:20 a.m. ET

Revenue trends
In the second quarter, Spectrum Pharmaceuticals (SPPI) generated net revenues of $24.2 million compared to $34.3 million in Q2 2017. In the first half of the year, Spectrum Pharmaceuticals reported net revenues of $54.7 million compared to $63.4 million in H1 2017.
Spectrum Pharmaceuticals reported revenues of $23.8 from product sales in the second quarter of 2018 compared to $31.2 million in Q2 2017. In the first half, revenues from product sales for Spectrum Pharmaceuticals was $51.9 million compared to $57.0 million in the first half of 2017.
Spectrum Pharmaceuticals’ Folotyn and Evomela generated revenues of $11.7 million and $5.8 million, respectively, in the second quarter of 2018. Spectrum Pharmaceuticals Beleodaq, Zevalin, Marqibo, and Fusilev reported revenues of $2.7 million, $1.6 million, $1.1 million, and $0.8 million, respectively, in the second quarter.
Nektar Therapeutics (NKTR), Ionis Pharmaceuticals (IONS), and Sarepta Therapeutics (SRPT), peers in the biopharmaceuticals market, reported revenues of $1.1 billion, $117.8 million, and $73.5 million, respectively, in the second quarter of 2018.
Earnings trends
In the second quarter, Spectrum Pharmaceuticals reported GAAP (generally accepted accounting principles) net income of $13.7 million compared to net income of -$20.9 million in the second quarter of 2017. Spectrum Pharmaceuticals reported GAAP EPS (earnings per share) of $0.13 in the second quarter compared to EPS of -$0.27 in the same period last year.
In the second quarter, Spectrum Pharmaceuticals reported non-GAAP net income and non-GAAP EPS of -$21.6 million and -$0.21 compared to -$8.6 million and -$0.11 in Q2 2017, respectively.
In the first half of the year, Spectrum Pharmaceuticals reported net income and diluted EPS of -$2.0 million and -$0.02, respectively, compared to net income and EPS of -$44.4 million and -$0.57 in the same period the prior year.
The earnings growth of Spectrum Pharmaceuticals could boost the stock prices of the iShares NASDAQ Biotechnology ETF (IBB). Spectrum Pharmaceuticals makes up about ~0.27% of IBB’s total portfolio.
Expense trends
In the second quarter, Spectrum Pharmaceuticals reported cost of sales, SG&A (selling, general and administrative), and R&D (research and development) expenses of $6.6 million, $23.5 million, and $21.5 million, respectively, compared to $11.3 million, $17.4 million, and $15.2 million in the second quarter of 2017.
