How BP’s Debt Position Compares
In this part, we’ll review whether BP’s (BP) debt position has improved. Let’s begin by comparing BP’s debt position with peers’.
Dec. 4 2020, Updated 10:53 a.m. ET

Comparing BP’s debt position with peers’
In this part, we’ll review whether BP’s (BP) debt position has improved. Let’s begin by comparing BP’s debt position with peers’. BP’s total debt-to-capital ratio was 38% in the first quarter, higher than its peers’ average of 33%. The peer average considers 13 integrated energy companies worldwide. ExxonMobil’s (XOM), Royal Dutch Shell’s (RDS.A), and Chevron’s (CVX) ratios stood at 17%, 33%, and 21%, respectively. BP’s net debt-to-adjusted EBITDA ratio was 1.4x in the first quarter, below the industry average of 1.6x.
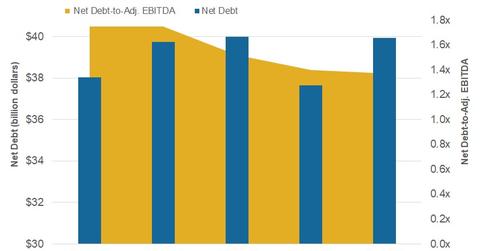
BP’s net debt-to-adjusted EBITDA trends
In the first quarter, BP’s net debt-to-adjusted EBITDA ratio fell YoY (year-over-year) from 1.7x to 1.4x, and its net debt rose to $39.9 billion due to marginal debt growth and lower cash. However, BP’s adjusted trailing-12-month EBITDA rose. As its EBITDA rose more steeply than its net debt, its net debt-to-adjusted EBITDA ratio fell.
In a nutshell
Although BP’s total debt-to-capital ratio was above average, BP’s net debt-to-EBITDA ratio has fallen below average. The lower ratio is a positive sign. Also, its total debt levels rose between Q1 2017 and Q3 2017 and then declined in Q4 2017 and Q1 2018, suggesting it has been working on its debt.
Analysts expect BP’s earnings to rise significantly this year, led by higher upstream earnings. With higher earnings, BP could witness higher surplus cash, which could be used to repay some of its debt. Therefore, if BP continues to focus on debt reduction, its debt could fall. In the next part, we’ll conclude this series by looking at whether BP’s cash flow could improve this year.
