Do General Electric’s Free Cash Flows Support Dividend Payments?
General Electric’s (GE) dividend CAGR (compound annual growth rate) for the last seven years was ~7%.
June 14 2017, Updated 11:35 a.m. ET

General Electric’s dividend payout
General Electric’s (GE) dividend CAGR (compound annual growth rate) in the last seven years ending 2016 was ~7%. The company has increased its cash equity dividends for seven years of the last ten years. However, markets haven’t been impressed with this single-digit growth. The 2Q17 dividend of $0.24 per share translates to a dividend payout ratio of 58.9%.
General Electric’s free cash flows
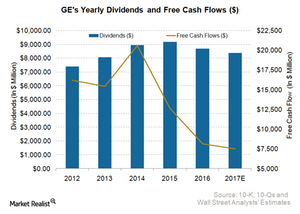
As the above graph shows, GE’s free cash flows have fallen significantly in recent years. Wall Street analysts aren’t expecting a substantial rise in GE’s free cash flow in 2017. In fact, Wall Street analysts estimate the company’s 2017 free cash flows at ~$7.5 billion, lower than the previous year’s levels.
A quick look at GE’s cash flow statement suggests that the company’s operating cash flows have fallen in recent quarters. The capital expenditure, however, has remained range bound during that period. Based solely on free cash flows, we can conclude that the current level of free cash flow doesn’t support the dividend payments.
Will the operating cash flows rise?
Baker Hughes’s (BHI) merger with General Electric’s oil and gas division has gotten the green light from the European Commission. With the present levels of crude oil prices, the oil and gas business is enjoying positive sentiments. This optimism along with a solid healthcare business might lift the company’s operating cash flows going forward. This should be a relief to the pure dividend investors hoping for a dividend rise in the future.
ETF investment
Around 106 ETFs have General Electric (GE) in their portfolio. Investors hoping for indirect exposure to GE can opt for the iShares Global Industrials ETF (EXI). GE makes up 6.2% of the portfolio holdings of EXI. Apart from GE, prominent industrial names included in EXI are 3M (MMM), Boeing (BA), Siemens (SIEGY), and Honeywell International (HON).
Keep reading to know more about how GE stands in the peer group in terms of forward dividend yield.
