Halliburton’s Next 7-Day Stock Price Forecast
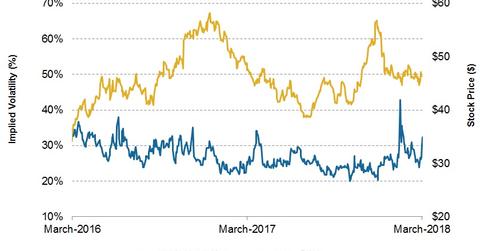
Halliburton stock will likely close between $48.52 and $44.36 in the next seven days—based on its implied volatility.
March 26 2018, Updated 2:50 p.m. ET

Halliburton’s implied volatility
Halliburton’s (HAL) implied volatility was 32.3% on March 23, 2018. On January 22, 2018, the day Halliburton released its 4Q17 earnings, its implied volatility was 23%. Since then, Halliburton’s implied volatility has increased. Halliburton accounts for 3.2% of the SPDR S&P Oil & Gas Equipment & Services ETF (XES). XES provides exposure to the energy sector’s oil and gas equipment and services segment. XES has decreased 21% since January 22—compared to an 18% fall in Halliburton’s stock price during the same period. The implied volatility signals a stock’s potential price movement as viewed by the option holders.
Halliburton’s seven-day stock price forecast
Halliburton stock will likely close between $48.52 and $44.36 in the next seven days—based on its implied volatility. Halliburton’s seven-day stock price forecast is based on a normal distribution of stock prices and one standard deviation probability of 68.2%. Halliburton’s stock price was $46.44 on March 23.
Implied volatility for Halliburton’s peers
On March 23, TechnipFMC’s (FTI) implied volatility was 35.6%. TechnipFMC’s stock price could vary between $30.84 and $27.94 in the next seven days. McDermott International’s (MDR) implied volatility was 45.6% on March 23. McDermott International’s stock price could range between $7.11 and $6.27 in the next seven days. Weatherford International’s (WFT) implied volatility was ~71% on March 23. Weatherford International’s stock price could vary between $2.62 and $2.16 in the next seven days.
Crude oil’s implied volatility
On March 23, crude oil’s implied volatility was 24.7%. Since January 22, 2018, crude oil’s volatility has increased. Halliburton’s implied volatility also increased during the same period.
Next, we’ll discuss crude oil’s correlation with Halliburton.
