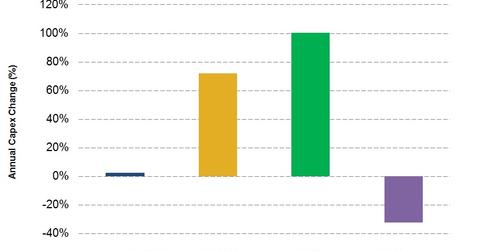
SLB, HAL, NOV, and BHGE: Comparing the Capex Growth
National Oilwell Varco’s (NOV) capital expenditure or capex fell ~32% in fiscal 2017—compared to its capex spend in fiscal 2016.
Dec. 4 2020, Updated 10:53 a.m. ET

Which company’s capex fell the most?
In this part, we’ll compare the capex growth for the four OFS (oilfield equipment and services) companies in our set. National Oilwell Varco’s (NOV) capital expenditure or capex fell ~32% in fiscal 2017—compared to its capex spend in fiscal 2016. National Oilwell Varco had the steepest capex decline in our select portfolio. In 2017, National Oilwell Varco spent ~$192 million on capex—compared to $284 million in 2016. National Oilwell Varco’s capex mainly declined in its Wellbore Technologies segment in 2017—compared to 2016.
Schlumberger’s capex in 2017
Schlumberger (SLB) recorded 2.5% capex growth in 2017—compared to 2016. Schlumberger had the lowest capex rise in our select portfolio. In 2017, Schlumberger spent ~$2.11 billion on its capex—compared to $2.05 billion a year ago. Schlumberger plans to keep the capex unchanged in 2018—compared to 2017.
Halliburton’s increased capex in 2017
Halliburton (HAL) increased its capex ~72% in 2017—compared to 2016. In 2017, Halliburton spent $1.37 billion on its capex—compared to $798 million a year ago. Most of Halliburton’s 2017 capex was spent on Production Enhancement, Sperry Drilling, Production Solutions, Wireline and Perforating, and Baroid product service lines. In 2018, Halliburton plans to increase its capex 25%—compared to 2017. Halliburton accounts for 3.6% of the SPDR S&P Oil & Gas Equipment & Services ETF (XES). XES decreased 28% in the past year—compared to a 14% decrease in Halliburton’s stock price during the same period.
Baker Hughes’s strong capex growth in 2017
Baker Hughes’s, a GE company (BHGE), capex nearly doubled in 2017—compared to 2016. In 2017, Baker Hughes spent ~$665 million on its capex—compared to $332 million in 2016. In 2018, Baker Hughes’s management plans to spend 5% of its annual revenues on the capex. In comparison, Baker Hughes spent nearly 4% of its revenues on the capex in 2017.
Next, we’ll discuss these companies’ free cash flow growth.
