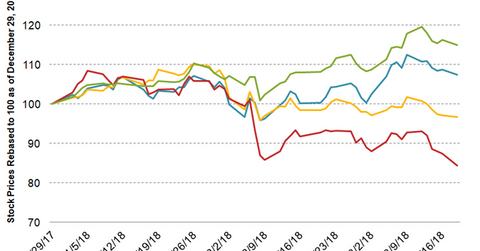
How Olin Stock Has Fared in 2018 Year-to-Date
On a year-to-date basis, until March 19, 2018, OLN stock has fallen 15.5%.
March 22 2018, Updated 9:01 a.m. ET

Olin’s stock performance in 2018
So far in 2018, Olin (OLN) stock has underperformed the market. On a year-to-date basis until March 19, 2018, OLN stock has fallen 15.5%.
In comparison, LyondellBasell (LYB) has fallen 3.2% while Eastman Chemical (EMN) and Westlake Chemical (WLK) have risen 15.0% and 7.4%, respectively, for the same period.
The fall in Olin’s stock price is helped by the prevailing volatility in the stock market. As OLN has a high beta of ~1.6, it’s natural that its price would fall more than the broader market.
However, the prime reason for the weakness in the stock was due to Olin’s lower-than-expected 4Q17 earnings. OLN reported adjusted earnings per share of $0.35 compared to analysts’ expectations of $0.42.
In 1Q18, OLN is expected to undergo substantial maintenance, which would impact its revenues and net income. As a result, some analysts have cut Olin’s target price.
Moving averages
Olin’s (OLN) underperformance has resulted in its stock trading 14.1% below its 100-day moving average price of $34.96, indicating prevailing weakness. However, OLN’s 14-day relative strength index (or RSI) score of 31 indicates that the stock is close to moving into oversold territory.
Also, the company’s short interest data suggest that bearishness in the stock has begun to increase, indicating negative sentiment in the stock that could drag down its stock price.
Investors can indirectly hold OLN through the First Trust Materials AlphaDEX ETF (FXZ), which had 0.5% exposure to Olin on March 19, 2018.
