Key Technical Levels in Tesla Stock before Its 4Q17 Event
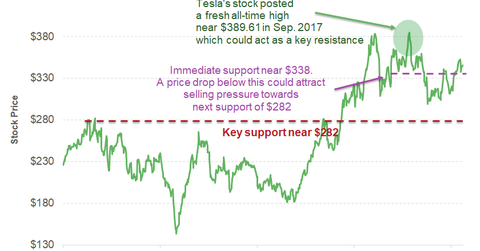
On January 30, Tesla stock was trading on a slightly positive note at $345.82. In September 2017, the stock posted an all-time high of near $389.61.
Nov. 20 2020, Updated 1:16 p.m. ET

Tesla’s 4Q17 earnings event
In the previous part of this series, we learned that Tesla’s (TSLA) valuation multiples are trending higher compared to those of legacy automakers such as Toyota Motor (TM), Ford Motor Company (F), and General Motors (GM).
Valuation multiples can help investors make informed investment decisions, but it’s also important to look at key technical areas. These technical support and resistance levels can help investors refine their entries into and exits from stocks.
Key technical levels for Tesla stock
On January 30, Tesla stock was trading on a slightly positive note at $345.82. In September 2017, the stock posted an all-time high of near $389.61, which should continue to act as its key resistance level. The stock could see immediate resistance near $357. On January 30, the stock’s price was trading above its 50-day simple moving average of $327, suggesting strength in its price action.
Tesla’s 14-day RSI (relative-strength-index) was hovering at 62.1, above the line of equilibrium (or the 50 mark). If a stock’s RSI level is above the line of equilibrium, it means that there’s a positive bias in its underlying momentum.
An immediate support level for Tesla stock lies near the $338 price level, and a breach below this support level could trigger another sell-off in the near term.
Auto industry’s 4Q17 earnings season
Legacy automakers (XLY) Ford Motor Company and Fiat Chrysler Automobiles (FCAU) released their fourth-quarter earnings results on January 24 and January 25, respectively. General Motors, the largest US auto company, will be announcing its 4Q17 earnings results a day before Tesla, on February 6.
Visit Market Realist’s Autos page to stay updated on analysts’ estimates and earnings reviews for these auto companies.
