GlaxoSmithKline’s Valuations after Its 4Q17 Earnings
On February 15, 2018, GlaxoSmithKline traded at a forward PE multiple of 12.9x, which is lower than the industry average of 13.3x.
Feb. 21 2018, Updated 7:32 a.m. ET

GlaxoSmithKline’s valuations
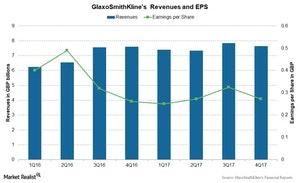
As we discussed earlier, GlaxoSmithKline (GSK) surpassed Wall Street analysts’ estimates for earnings per share (or EPS) and revenues for 4Q17. GSK reported EPS of 27.2 pence on revenues of ~7.6 billion pounds during 4Q17.
The chart below shows GSK’s revenues and earnings per share since 1Q16. For fiscal 2017, GlaxoSmithKline surpassed Wall Street analysts’ estimates for EPS and revenues. It reported EPS of 1.12 pounds on revenues of ~30.2 billion pounds. This reflected 8.2% growth in revenues compared to ~27.9 billion pounds during 2016.
Forward PE ratio
GlaxoSmithKline’s (GSK) forward price-to-earnings (or PE) ratio considers its current stock price over its estimated earnings per share. On February 15, 2018, GlaxoSmithKline traded at a forward PE multiple of 12.9x, which is lower than the industry average of 13.3x.
Among its competitors, Merck & Co. (MRK), Pfizer (PFE), and Sanofi (SNY) posted forward PE ratios of 13.1x, 11.8x, and 11.8x, respectively.
Forward EV-to-EBITDA multiple
On a capital structure–neutral basis, GSK trades at a forward EV-to-EBITDA[1. enterprise value to earnings before interest, tax, depreciation, and amortization] multiple of ~8.1x, which is lower than the industry’s average of ~10.8x.
Among its competitors, Merck & Co. (MRK), Pfizer (PFE), and Sanofi (SNY) have higher forward EV-to-EBITDA multiples of 10.8x, 10.3x, and 8.2x, respectively, compared to GlaxoSmithKline.
The VanEck Vectors Pharmaceuticals ETF (PPH) holds 5.1% of its total investments in GlaxoSmithKline ADR (GSK), 4.8% in Merck & Co. (MRK), 4.7% in Pfizer (PFE), and 4.4% in Sanofi ADR (SNY).
