Comparing China and US Vehicle Sales in January 2018
In January 2018, total US auto sales rose about 1.0% YoY to 1.15 million vehicle units, reflecting a slower growth rate than China.
Feb. 28 2018, Updated 9:50 a.m. ET

January 2018 China auto sales
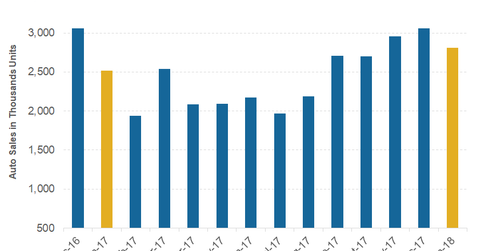
According to data provided by the China Association of Automobile Manufacturers, Chinese market vehicle sales (IYK) stood at ~2.8 million vehicle units in January 2018. This reflected a minor increase of about 0.1% from the Chinese auto sales in January 2017.
In December 2017, China’s auto sales increased 0.1% YoY (year-over-year). January 2018 was the eighth straight month when Chinese vehicle sales witnessed positive YoY growth.
According to Reuters, new-energy vehicle sales in China jumped 430.9% in January 2018 to ~38,470 units. This impressive YoY growth was primarily due to the Chinese government’s sales tax waiver on such vehicles.
Comparing with US auto sales
In January 2018, total US auto sales rose about 1.0% YoY to 1.15 million vehicle units, reflecting a slower growth rate than China.
The US sales of trucks and utility vehicles have notably risen in the last three years, compared to the sales of small cars in the country. In January 2018, US truck sales rose 8%, and car sales fell 10.8% YoY.
Last year, China’s total vehicle sales rose 3.0% YoY to ~28.9 million units. US auto sales fell ~1.8% YoY to ~17.2 million vehicles in 2017.
China is the world’s top automobile market by sales volume. In the last few years, key auto industry players such as Ford (F), Toyota (TM), General Motors (GM), and Fiat Chrysler Automobiles (FCAU) have increased their focus on China.
Existing strength in the Chinese vehicle market and its immense growth potential could be the primary reasons for these global automakers to bet high in China.
Now, let’s see how Ford’s (F) China sales looked in January 2018.
