How Steel Companies’ PE Ratios Stack Up
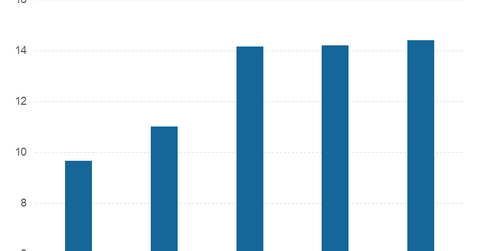
AK Steel (AKS) has the lowest forward PE multiple of 9.7 among our select group of steel stocks.
Jan. 3 2018, Updated 7:34 a.m. ET

Steel companies’ PE ratio
The PE (price-to-earnings) ratio is the most widely used valuation metric. In this article, we’ll look at different steel companies’ PE ratios. We’ll also look at the PEG (price-to-earnings-to-growth) ratio.
2018 PE multiple
AK Steel (AKS) has the lowest forward PE multiple of 9.7 among our select group of steel stocks. U.S Steel (X), Nucor (NUE), and Steel Dynamics (STLD) have similar forward PE multiples based on 2018 expected earnings. ArcelorMittal (MT), the world’s largest steel producer, is trading at a forward PE multiple of 11.02x. In September, Ronnie Moas of Standpoint Research downgraded U.S. Steel (X) from “buy” to “reduce.” Among other factors, the brokerage listed U.S. Steel’s high PE (price-to-earnings) ratio as a bearish driver.
PEG ratio
However, we should read PE multiples along with company outlooks, especially earnings growth. The PEG ratio standardizes the PE ratio for the expected earnings growth. Let’s take a quick look at steel companies’ PEG ratio. U.S. Steel has the lowest PEG ratio of 0.11x, while Steel Dynamics has the highest PEG ratio of 0.57 among our select group of steel stocks. AK Steel (AKS) has the second lowest PEG ratio of 0.23. While U.S. Steel could look overvalued based on its PE multiple, analysts expect its earnings to rise next year, which could justify its high valuation. Simply put, we can’t consider U.S. Steel as “expensive” based on its high PE ratio. However, we should remember that U.S. Steel’s earnings are more volatile as compared to its peer companies.
In the next and final article, we’ll read steel companies’ valuation in conjunction with their free cash flows.
