What Miners’ Technical Indicators Suggest
Most of the miners have seen an upswing in their prices over the past week.
Aug. 4 2017, Published 10:19 a.m. ET

Miners’ technicals
Most of the miners have seen an upswing in their prices over the past week. The last trading day in July saw ups and downs in mining stocks’ price movements. Often mining stocks follow the metals they mine. However, the two sometimes diverge.
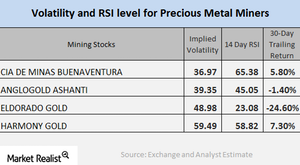
In this article, we’ll look at some important technical indicators including volatility figures and RSI levels for major mining stocks like Cia De Minas Buenaventura (BVN), AngloGold Ashanti (AU), Eldorado Gold (EGO), and Harmony Gold (HMY).
Implied volatility
The call-implied volatility is a measurement of the fluctuations in an asset’s price when it comes to the fluctuations of the price of its call option. On August 2, 2017, Cia De Minas, AngloGold, Eldorado Gold, and Harmony had volatilities of 37%, 39.4%, 49%, and 59.5%, respectively. The volatilities of mining stocks are usually greater than the volatilities of precious metals.
RSI
RSI (relative strength index) is a measurement that indicates whether a stock has been overbought or oversold. If a stock’s RSI is above 70, it may be overbought, and its price may drop. If a stock’s RSI is below 30, it could be oversold and might correct upward.
RSI levels for the miners mentioned above have recently witnessed revivals. Cia De Minas, AngloGold, Eldorado Gold, and Harmony have RSI levels of 65.4, 45.1, 23.1, and 58.8, respectively. There’s been a reasonable rebound in the prices of precious metals.
Precious-metal-based funds like the Physical Swiss Gold Shares (SGOL) and the Physical Silver Shares (SIVR) are also impacted by changes in precious metal prices. These two funds have risen 9.9% and 3.9%, respectively, on a YTD basis.
