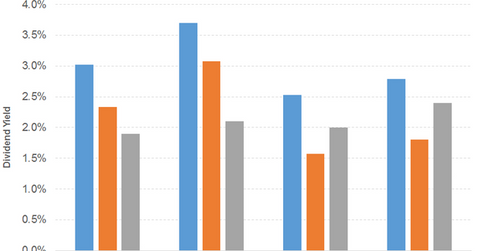
Dividend Yield of Nucor
Nucor’s (NUE) PE ratio of 21.8x is pitted against a sector average of 19.4x. The dividend yield of 1.5% is pitted against a sector average of 1.4%.
Aug. 23 2017, Published 12:43 p.m. ET

Nucor: Basic materials sector, steel and iron industry
Nucor (NUE) is a producer of steel and interrelated products in the United States. Sales for the company have declined from fiscal 2015 through fiscal 2016. The fall was due to lower contributions from steel mills, steel products, and raw materials. Every product except sheet mills recorded a decline in fiscal 2016. Steel mills were shaken by sales price volatility and demand. The company’s EPS (earnings per share) growth for fiscal 2016 was driven by earnings from equity investments, the absence of impairments, and lower interest expenses.
Sales for the first half of 2017 recorded impressive growth, driven by all the segments, mainly steel mills. The gradual recovery of commodity prices played a key role, which translated to impressive EPS growth.
In the graph below, we can see Nucor’s dividend yield compared to the S&P 500 and Steel Dynamics (STLD). (The asterisk in the graph denotes an approximation in calculating dividend yield.)
Quarterly dividend
The growth in the quarterly dividend in June 2017 represents the company’s 177th successive quarterly cash dividend. Free cash flow has improved over the years. The dividend yield has been quite impressive and is above the S&P 500.
Nucor’s PE (price-to-earnings) ratio of 21.8x is pitted against a sector average of 19.4x. The dividend yield of 1.5% is pitted against a sector average of 1.4%. In the graph below, we can see Nucor’s price movement compared to the S&P 500 and Steel Dynamics.
The cyclical nature of the industry renders the business vulnerable to a slowdown in the economy. Earnings per share for 3Q17 is expected to be at par with the performance in the first half of 2017 due to the recovery of the energy markets. Non-residential construction pointers such as the Dodge Momentum Index and the Architecture Billings Index continue to reflect healthy construction activity for fiscal 2017. Recovery of the labor market and lower gasoline prices are expected to drive vehicle sales numbers going forward. Once oil prices start picking up, it will trigger the demand levels for energy-related steel.
The SPDR S&P Dividend ETF (SDY) offers a dividend yield of 2.5% at a PE ratio of 20.0x. It’s a diversified ETF. The PowerShares S&P 500 High Dividend ETF (SPHD) offers a dividend yield of 3.8% at a PE ratio of 17.3x. It’s a diversified ETF with substantial exposure to real estate.
