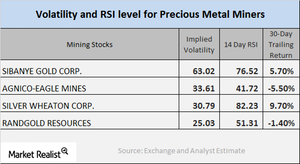
What Mining Stocks’ Implied Volatility Tells Us
As of October 24, 2017, Silver Wheaton (SLW), Yamana Gold (AUY), Barrick Gold (ABX), and AngloGold Ashanti (AU) had implied volatility readings of 30.8%, 48.4%, 29.1%, and 40.9%, respectively.
Oct. 27 2017, Updated 7:38 a.m. ET

Technical analysis
When investors consider investing in mining stocks, there are a few key indicators that they need to watch. In this part, we’ll discuss the RSI (relative strength index) levels and call implied volatility. Mining stocks’ volatility can often be higher than the volatility of the metals.
Call implied volatility measures the fluctuations in an asset’s price given the variations in the price of its call option. The RSI indicates whether a share is overpriced or underpriced. Above 70 suggests that it’s overbought and below 30 suggests that it’s oversold.
The Physical Silver Shares (SIVR) and the Physical Swiss Gold Shares (SGOL) lost 0.78% and 0.49%, respectively, on October 24, 2017. Thus, a downward movement in price could lead to a fall in the mining funds, while a rise could lead to an increase.
Call implied volatility and RSI level
As of October 24, 2017, Silver Wheaton (SLW), Yamana Gold (AUY), Barrick Gold (ABX), and AngloGold Ashanti (AU) had implied volatility readings of 30.8%, 48.4%, 29.1%, and 40.9%, respectively. The above mining stocks’ RSI levels also recovered after their September slump in price. Silver Wheaton, Yamana, Barrick Gold, and AngloGold have RSI scores of 68, 39.2, 32.1, and 45.9, respectively.
In general terms, an RSI level above 70 indicates that the stock price might fall, while an RSI below 30 indicates that the price might rise.
