What Are Weatherford International’s Growth Drivers in 1Q17?
In 1Q17, Weatherford International’s net loss was $443 million.
July 18 2017, Updated 7:41 a.m. ET

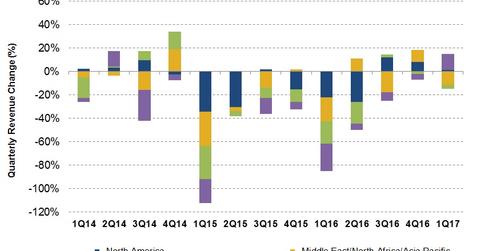
Weatherford International’s geographic growth
Weatherford International’s (WFT) Middle East/North Africa/Asia Pacific region revenues fell the most (12% fall) from 4Q16 to 1Q17. On the other hand, revenues in WFT’s Europe/CIS/West Africa region rose 14% rise) during the same period. WFT divested its land drilling assets in 1Q17. WFT makes up 0.27% of the ProShares Ultra Oil & Gas ETF (DIG). Since March 31, 2017, DIG fell 15% compared to a 38% decrease in WFT’s stock price.
Comparison with peers
In 1Q17, Weatherford International’s net loss was $443 million. In comparison, Halliburton’s (HAL) net loss was $32 million in 1Q17, while Schlumberger’s (SLB) net income was $284 million in the quarter. National Oilwell Varco’s (NOV) net loss was $120 million in 1Q17. The Dow Jones Industrial Average (DJIA-INDEX) rose 22% in the past one year versus a 31% fall in WFT’s stock price.
Growth drivers
- Sub-Sahara Africa and Europe saw increased low margin product sales
- Latin America witnessed higher well construction and secure drilling services sales
- 25% higher North America rig count in 1Q17 over 4Q16, which positively affected WFT’s drilling services and wireline product, artificial lift, and completion lines sales
Negative factors affecting WFT’s 1Q17 performance
- weakened pricing and falling product sales in the Middle East/North Africa/Asia Pacific
- decreased drilling and contract activity in the Gulf states
Weatherford’s cost reduction plans
By March 2017, Weatherford reduced its employee count by 2,500 employees out of the planned reduction of 3,000 employees. The company also stopped operations in an additional six manufacturing facilities during 1Q17. WFT plans to complete the cost reduction process by 2Q17. Christoph Bausch, WFT’s chief financial officer, commented in the 1Q17 earnings conference call, “We have now a good foundation to optimize our manufacturing operations to meet the increased requirements in North America, and to operate at a lower cost level in order to be competitive in this market environment, going forward. As explained previously, we see no capacity constraints based on our roofline and machining capabilities. And we have started to add qualified personnel in some of our key manufacturing operations.”
Next, we’ll discuss how US rig count could affect WFT’s 1Q17 financial results.
