Amazon’s Debt Analysis
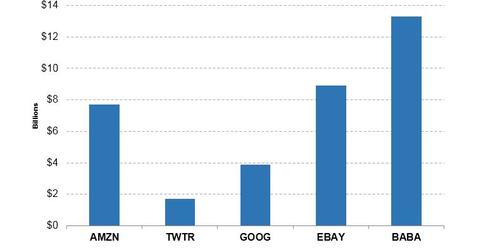
Amazon’s (AMZN) balance sheet reflects total debt of $7.7 billion. The company reported total capital of ~$29.4 billion, and its total-debt-to-total-capital ratio is 50%.
July 3 2017, Updated 7:37 a.m. ET

Dissecting Amazon’s debt situation
Amazon’s (AMZN) balance sheet reflects total debt of $7.7 billion. The company reported total capital of ~$29.4 billion, and its total-debt-to-total-capital ratio is 50%.
Peers Twitter (TWTR), Alphabet (GOOG), eBay (EBAY), and Alibaba (BABA) have total debt of ~$1.7 billion, ~$3.9 billion, ~$8.9 billion, and ~$13.3 billion, respectively.
Amazon has debt-to-equity, debt-to-assets, and debt-to-EBITDA[1. earnings before interest, tax, depreciation, and amortization] ratios of ~35.5, 0.09, and 0.60, respectively.
As another important ratio, EBIT-to-interest measures how easily a company can pay interest on its outstanding debt, also known as the interest coverage ratio. Amazon’s EBIT-to-interest ratio stands at ~32.6x. The company’s debt-to-enterprise-value is 2.0%.
Earnings and sales
Amazon reported EPS (earnings per share) of ~$5.00 in 2016, while its EPS for 2017 is forecast to be ~$6.70.
Amazon’s 2016 EPS came from total sales of ~$142.6 billion, which grew 26.0% annually. Amazon’s 2017 sales increase to ~$166.1 billion, and its 2018 sales are expected to reach ~$200.8 billion.
Inside Amazon’s price metrics
With a book value per share of ~$46.02, Amazon is trading at a price-to-book value of 21.5x. The estimated book value per share of the stock is ~$53.90.
Amazon’s price-to-sales ratio is 3.3x, and its estimated price-to-sales ratio is 2.8x.
EBITDA in focus
Amazon’s 2016 EBITDA of $12.8 billion fell 36%, and it’s expected to fall 24% to $19.1 billion in 2017. Amazon (AMZN) stock is trading at a price-to-EBITDA ratio of 36.4x.
