What Drove Schlumberger in 1Q17
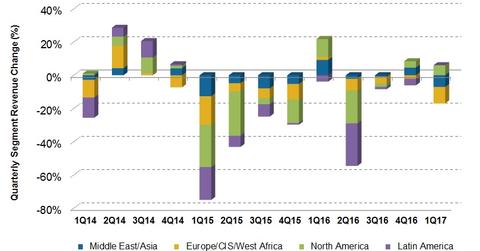
Schlumberger’s 1Q17 revenue by geography From 4Q16 to 1Q17, Schlumberger (SLB) witnessed 6% revenue growth in North America, while it saw a steep revenue decline of ~10% in the Europe/CIS[1.Commonwealth of Independent States]/West Africa region. Schlumberger’s revenue from Latin America was resilient in 1Q17, remaining unchanged from 4Q16. Schlumberger accounts for 6.5% of the ProShares […]
July 6 2017, Updated 10:37 a.m. ET

Schlumberger’s 1Q17 revenue by geography
From 4Q16 to 1Q17, Schlumberger (SLB) witnessed 6% revenue growth in North America, while it saw a steep revenue decline of ~10% in the Europe/CIS[1.Commonwealth of Independent States]/West Africa region. Schlumberger’s revenue from Latin America was resilient in 1Q17, remaining unchanged from 4Q16. Schlumberger accounts for 6.5% of the ProShares Ultra Oil & Gas ETF (DIG). From December 30, 2016, to March 31, 2017, DIG fell 14%, whereas Schlumberger fell 7%.
Schlumberger’s segment margin analysis
Schlumberger’s positive drivers
- strong fracking and a higher stage count leading to higher North American onshore drilling activity
- higher artificial lift products sales in Canada
- strong drilling and project activity in Colombia, Peru, and Ecuador
- higher revenue from Egypt following strong unconventional onshore activity and perforating activity
Schlumberger’s negative drivers
- low pricing environment for oilfield services and equipment (or OFS) companies
- lower activity in Schlumberger’s Reservoir Characterization and Cameron groups
- rig count decline in Mexico and Central America due to upstream companies’ budget constraints
- India saw lower equipment sales in 1Q17
- Russia saw seasonal activity decline in 1Q17
