Salesforce’s EV-to-EBITDA Multiple Compared to Its Peers
Microsoft’s forward annual dividend yield was ~2.3% on May 15, 2017, and Oracle’s and IBM’s yields were ~1.7% and ~4.0%, respectively.
May 31 2017, Updated 4:29 p.m. ET

Salesforce’s EV-to-EBITDA ratio
Earlier in this series, we discussed Salesforce’s (CRM) value proposition in the software space. In this article, we’ll look at Salesforce’s EV-to-EBITDA[1. enterprise value to earnings before interest, tax, depreciation, and amortization] multiple. We’ll also look at other US software players.
EV-to-EBITDA multiples are widely used in the valuation of companies across various sectors. EV represents the market value of a company’s equity and debt, minus cash and cash equivalents. So, the EV-to-EBITDA ratio helps us determine whether a company is undervalued or overvalued.
Currently, Salesforce’s EV-to-EBITDA multiple is 83.59. The forward EV-to-EBITDA multiples for Salesforce’s peers follow:
Salesforce’s dividend yield
Microsoft’s forward annual dividend yield was ~2.3% on May 15, 2017, and Oracle’s and IBM’s yields were ~1.7% and ~4.0%, respectively. Unlike its peers in the software space, Salesforce doesn’t pay dividends.
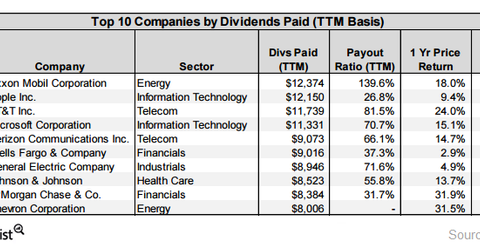
The chart above shows that during the trailing-12-month period, Apple and Microsoft were among the top ten companies in the IT sector to spend the most on stock buybacks.
Investors who want exposure to Salesforce could consider investing in the SPDR S&P 500 ETF (SPY) (SPX). SPY has an ~29% exposure to application software. It invests ~0.23% of its holdings in Salesforce.
In the final part of our series, we’ll see what analysts are recommending for Salesforce.
Correction: This article originally included a wayward dollar sign next to Salesforce’s EV-to-EBITDA multiple.
