Did Analysts Change Their Views on Target after 1Q17 Results?
The majority of analysts covering Target (TGT) remain neutral on the stock.
Nov. 20 2020, Updated 10:46 a.m. ET

Ratings and price target
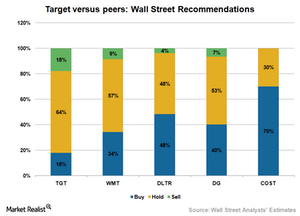
The majority of analysts covering Target (TGT) remain neutral on the stock with a consensus rating of 2.9 on a scale where one is a strong buy and five is a strong sell. However, the percentage of analysts having a negative outlook on the stock increased despite the company’s better-than-expected fiscal 1Q17 results.
As of May 18, 2017, 18.0% of analysts have recommended a “buy” on Target stock, down from 19% on May 11. About 64.0% have recommended a “hold,” and 18.0% have recommended a “sell.” On May 18, 2017, Target was trading at $55.83 per share, 5.9% lower than analysts’ 12-month price target of $59.11.
As discussed earlier, the company’s recovery remains distant despite the better-than-expected fiscal 1Q17 results, so analysts remain neutral on the stock. Although the company’s efforts to drive top-line growth look promising, it’s too early to conclude that Target will recover, especially when Target continues to disappoint on store traffic, its key operating metric.
ETF investors seeking exposure to Target can invest in the Oppenheimer Ultra Dividend Revenue ETF (RDIV), which has 5.4% of its total holdings in the company.
Peer comparison
Of the 35 analysts covering Walmart (WMT) stock, 34% have recommended a “buy,” 57.0% have recommended a “hold,” and 9.0% have recommended a “sell.” As for Costco (COST) stock, 70.0% of analysts have rated the stock a “buy,” while 30.0% have a “hold” rating.
For Dollar Tree (DLTR), 48.0% of 27 analysts have rated the stock as a “buy,” 48.0% rate it as a “hold,” and 4.0% rate it as a “sell.” Of the 30 analysts who have rated Dollar General (DG) stock, 40.0% have rated it as a “buy,” 53.0% have rated it as a “hold,” and about 7.0% have rated it as a “sell.”
Valuation summary
On May 18, 2017, Target (TGT) was trading at a 12-month forward PE (price-to-earnings) multiple of 13.3x, lower than the S&P 500 Index’s (SPX) forward PE of 18.5x. The company is also trading at a discount to the peer group average of 18.6x.
On May 18, 2017, Walmart (WMT), Costco (COST), Dollar Tree (DLTR), and Dollar General (DG) were trading at forward PE multiples of 17.7x, 28.4x, 17.7x, and 16.0x, respectively.
Note that the 12-month forward PE is likely to differ among peers on account of numerous factors like growth expectations, leverage, profitability, business models, and risk-return profiles.
For more industry updates, visit Market Realist’s Mass Merchandisers page.
