A Look at a Technical Analysis of Amazon
On May 22, 2017, 2.6 million shares of Amazon (AMZN) exchanged hands, and the stock rose 1.1% to close at ~$970.7.
Dec. 4 2020, Updated 10:52 a.m. ET

Shareholder returns and stock trends
On May 22, 2017, 2.6 million shares of Amazon (AMZN) exchanged hands, and the stock rose 1.1% to close at ~$970.7.
Amazon stock has generated a return of ~38.1.% in the trailing-12-month period, compared to ~8.3% in the trailing-one-month period. It’s risen ~1.3% in the trailing-five-day period.
Moving averages
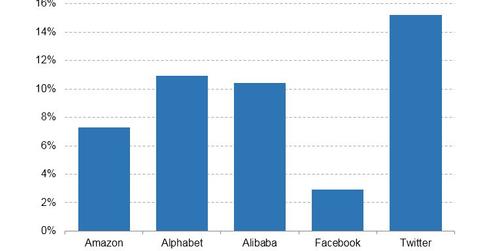
On May 22, 2017, Amazon was trading ~7.3% above its 50-day moving average. In comparison, Alphabet (GOOGL) was trading ~8.4% above its 50-day moving average, and Alibaba (BABA) was trading ~10.4% above its 50-day moving average on the same date. Facebook (FB) and Twitter (TWTR) were trading 2.9% and 15.2% above their 50-day moving averages, respectively, on the day.
Amazon’s stock price is currently ~2.8% above its 20-day moving average, while it’s ~12.3% above its 100-day moving average.
Moving average convergence divergence
The moving average convergence divergence (or MACD) refers to the difference between a stock’s long-term and short-term moving averages. A positive figure shows an upward trading trend, while a negative figure shows a downward trading trend. Amazon has recorded an MACD of 17.24 in the last 14 days.
Peer companies Alphabet, Alibaba, Facebook, and Twitter have reported MACDs of 22.71, 2.90, 1.80, and 0.88, respectively.
Bolinger Band
On May 23, Amazon’s stock price closed at ~$970.67, close to its upper Bolinger Band level of $979. This level implies that the stock could be overbought. When the price of a stock is close to the upper Bollinger Band, it’s considered to be overbought, which could trigger a sell signal for investors.
On the other hand, the price of the stock is considered oversold if it’s trading close to the lower Bolinger Band, which could trigger a buy signal for investors.
