Where Is the Gold-Silver Ratio Headed?
When analyzing the precious metals market, it’s important to take a look at the relationship between gold and silver.
March 24 2017, Updated 7:37 a.m. ET

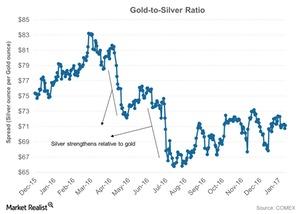
Gold-silver ratio
When analyzing the precious metals market, it’s important to take a look at the relationship between gold and silver. Most of the time, gold (SGOL) and silver (SIVR) move in the same direction.
The gold-silver spread was trading at 70.5 on March 20, 2017, which means that it takes 70 ounces of silver to buy a single ounce of gold. The peak of the gold-silver spread was close to 85 ounces in late 2008.
The gold-silver spread has fallen drastically over the past year. As of March 20, 2017, its RSI (relative strength index) was 72.1. The spread is also trading above its 20-day, 50-day, and 100-day moving averages. The RSI level of the gold-silver spread suggests a possible fall in the ratio.
A decline in the ratio means relative strength for silver over gold. Gold and silver were trading at $1,229.8 and $17.4 per ounce, respectively, as of March 20, 2017.
Mean reverting
In a bull market for precious metals, silver usually outperforms gold. The opposite tends to be the case in a bear market. When silver outperforms gold, the ratio falls, and when gold outperforms silver, the ratio tends to rise. The markets are scaling higher, and that could indicate a fall in the ratio.
Mining stocks are also affected by precious metals, especially gold and silver. Barrick Gold (ABX), New Gold (NGD), Agnico Eagle Mines (AEM), and AuRico Gold (AUQ) have recovered along with these precious metals.
