Air Products & Chemicals Stock: 2017 Performance So Far
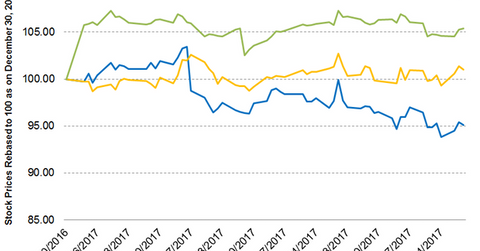
As of March 29, 2017, Air Products & Chemicals’ (APD) year-to-date stock performance was negative, falling 4.9% to date.
March 30 2017, Published 3:48 p.m. ET

Air Products & Chemicals stock
As of March 29, 2017, Air Products & Chemicals’ (APD) YTD (year-to-date) stock performance was negative, falling 4.9% to date. APD has also underperformed the broad-based SPDR S&P 500 ETF (SPY), which has risen 5.4% in the same period. By comparison, its peer Praxair (PX) has risen 1.0%.
The fall of APD stock was primarily driven by lower-than-expected 4Q16 earnings. APD’s revenues in 4Q16 were $1.88 billion, while analysts expected revenues of $1.96 billion. However, things might improve going forward since APD has managed to land several new businesses.
Moving averages and relative strength index
APD stock has underperformed its peer and the market as a whole, which has led to the stock trading 4.0% below its 100-day moving average of $142. On March 29, 2017, APD closed ~9.9% above its 52-week low of $124.10 and ~9.4% below its 52-week high of $150.45.
APD’s 14-day RSI (relative strength index) of 43 indicates that the stock is neither overbought nor oversold. Remember, an RSI of 70 means that a stock has moved temporarily into an overbought situation. An RSI below 30 indicates that a stock has moved temporarily into an oversold position.
You can indirectly hold APD by investing in the PowerShares DWA Basic Materials Momentum ETF (PYZ), which has 3.0% of its total portfolio in APD as of March 29, 2017. The top holdings of the fund include Chemours (CC) and FMC (FMC) with weights of 5.9% and 3.8%, respectively, for the same period.
In the next part of this series, we’ll take a close look at Air Products & Chemicals’ latest dividend, dividend yields, analysts’ ratings, and latest valuations.
