Flotek Industries’ Capex: Impact of a Credit Facility Agreement
In this article, we’ll analyze how Flotek Industries’ (FTK) operating cash flows trended over the past few quarters.
Feb. 28 2017, Updated 10:36 a.m. ET

Flotek Industries’ operating cash flows
In this article, we’ll analyze how Flotek Industries’ (FTK) operating cash flows trended over the past few quarters. We’ll also discuss how its free cash flows (or FCF) were affected, given its capital expenditure or capex.
Flotek Industries’ cash from operating activities (or CFO) fell 67% in 4Q16 over 4Q15. FTK generated a meager ~$3.0 million CFO in 4Q16. FTK’s revenues fell in the past year, leading to the lower CFO.
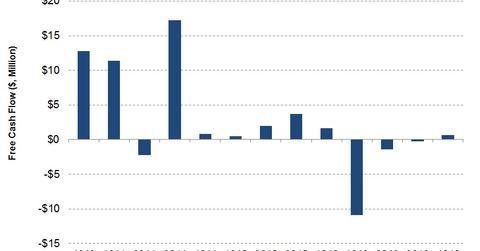
Flotek Industries’ free cash flow
In 4Q16, FTK was able to generate positive FCF after generating negative FCF in the previous three quarters. FTK’s capex fell 56% in 4Q16 over 4Q15. Lower capex couldn’t offset CFO’s decline and, in effect, FCF fell 61% in 4Q16 over 4Q15. In 4Q16, FTK’s FCF was $0.6 million, compared to $1.7 million positive FCF in 4Q15.
Halliburton’s (HAL) 4Q16 FCF was a negative $731 million. Baker Hughes’s (BHI) 4Q16 FCF was $454 million while Weatherford International’s (WFT) 4Q16 FCF was $68 million. Flotek Industries is 0.19% of the iShares Micro-Cap ETF (IWC).
FTK’s credit facility agreement and capex
Flotek Industries plans to spend between $15 million and $20 million on capex in 2017. The annual limit on capital expenditure could be affected if the undrawn availability of the revolving credit facility falls below $15 million. Read the previous part of this series to learn more about FTK’s credit facility.
