What Led to the Fall in Canadian Pacific’s Intermodal Volumes?
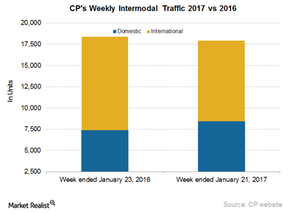
Canadian Pacific’s intermodal volumes Although Canadian Pacific’s (CP) intermodal volumes have been marching forward for the past few quarters, for the week ended January 21, 2017, CP reported a fall of 2.5% in overall intermodal traffic. Intermodal data indicates that the fall was due to a drop in its international intermodal business, where volumes fell […]
Nov. 20 2020, Updated 11:04 a.m. ET

Canadian Pacific’s intermodal volumes
Although Canadian Pacific’s (CP) intermodal volumes have been marching forward for the past few quarters, for the week ended January 21, 2017, CP reported a fall of 2.5% in overall intermodal traffic. Intermodal data indicates that the fall was due to a drop in its international intermodal business, where volumes fell 13.6%. However, domestic volumes surged 14% to settle at 8,500 containers and trailers, compared with 7,400 a year ago.
In the week ended January 21, 2017, CP’s intermodal traffic fell, contrasting with the rise reported by its close rival, Canadian National (CNI). CP’s intermodal traffic slump was also in contrast with the rise reported by Canadian railroads.
CP’s Domestic Intermodal segment
CP’s Domestic Intermodal segment made up 12.3% of CP’s revenue and 17.4% of its total volumes in 3Q16. International Intermodal contributed 10.7% of its revenue and 22.3% of its volumes in the same quarter.
Increased truck capacity in CP’s short-haul lane will most likely result in tough competition in the domestic intermodal space going forward. Since the company gets most of its domestic intermodal business from Canada, it will be heavily affected by growth in the Canadian economy.
The company’s international intermodal business consists of containerized traffic moving between the ports of Vancouver, Montreal, and New York. CP’s International Intermodal growth is tied to capacity growth at these ports. Retail demand and the pace of transpacific trade with China also have a bearing on international intermodal volumes of other Class I rail carriers (XLI).
The intermodal segments of railroads mainly compete with major US trucking companies such as J.B. Hunt Transport Services (JBHT), Old Dominion Freight Lines (ODFL), Swift Transportation (SWFT), and XPO Logistics (XPO).
Departures
In this series, we’ve examined the rail traffic data of major US railroads for the third week of 2017, or the week ended January 21, 2017. The ProShares Ultra S&P 500 ETF (SSO) invests ~7.6% in the industrial sector, which includes transportation and logistics. Investors interested in comparing this week’s freight volume data with that of the previous week can read A Carload of Freight Rail Traffic Data: The Week Ended January 14. For ongoing updates on major US railroad stocks, keep checking Market Realist’s Railroads page.
