Analyzing Chart Indicators for WEC Energy Stock
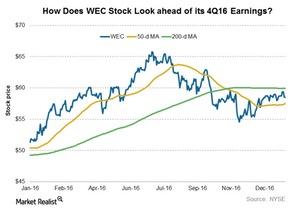
As of January 23, 2017, WEC Energy Group (WEC) stock was trading at a 2.0% premium to its 50-day moving average.
Jan. 26 2017, Updated 7:37 a.m. ET

WEC Energy: Chart indicators
As of January 23, 2017, WEC Energy Group (WEC) stock was trading at a 2.0% premium and a 2.0% discount to its 50-day and 200-day moving averages (or DMA), respectively. Its 50-DMA, a level near $57.50, may now act as a short-term support. Its 200-DMA, a level near $60, is likely to act as a resistance in the near term.
Relative strength index
Currently, WEC’s RSI (relative strength index) stands at 50. An RSI is a momentum indicator made up of values between zero and 100. Movements below 30 are considered to be in the “oversold” zone. Movements above 70 are considered in the “overbought” zone. RSI values can hint at imminent reversals in stock prices.
