Why the Gold-Palladium Spread Is Falling Drastically
Palladium has seen a YTD rise of a whopping 32.5%, which is higher than the rise in platinum, silver, and gold. Earlier, palladium was underperforming its precious metal peers.
Dec. 8 2016, Updated 2:05 p.m. ET

Mark Keenan on palladium
Mark Keenan, cross commodity strategist at Société Générale, wrote in a note,”We expect palladium to continue outperforming and recommend buying palladium on dips against platinum.”
He added, “Platinum is also facing headwinds from a weaker South African rand, which makes it more profitable to produce platinum.”
Gold-palladium ratio
Palladium has seen a year-to-date rise of a whopping 32.5%, which is higher than the rise in platinum, silver, and gold. Earlier, palladium was underperforming its precious metal peers, but now it’s outperforming them. In the past 30 trading days, palladium has risen 20.2%, while the other three precious metals have fallen.
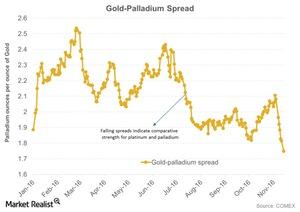
The graph below shows gold’s performance compared to palladium’s according to the gold-palladium spread, or the gold-palladium ratio. The spread measures the number of palladium ounces it takes to buy a single ounce of gold. The higher the ratio, the weaker palladium is compared to gold since more ounces of palladium are needed to buy an ounce of gold.
Spread movements
The gold-palladium spread has seen its ups and downs over the past few months. But the United Kingdom’s Brexit vote in June 2016 resulted in some strength for palladium, which was evident in falling cross-commodity rates.
Once again, palladium is overtaking gold. The spread fell substantially after July 2016. Palladium managed to dodge the recent fall in precious metals, which explains the fall in the spread. A rise in the gold-palladium spread indicates strength for gold, while a fall indicates strength for palladium.
RSI levels
The gold-platinum spread was approximately 1.7 on November 21, 2016. Its RSI (relative strength index) was as low as 26. An RSI level above 70 indicates that an asset has been overbought and could fall. An RSI level below 30 indicates that an asset has been oversold and could rise.
Fluctuations in these precious metals are closely reflected in funds such as the ETFS Physical Palladium (PALL) and the VanEck Merk Gold ETF (OUNZ).
Precious metal mining companies that have fallen in the past month include Alacer Gold (ASR), Gold Fields (GFI), Yamana Gold (AUY), and Harmony Gold Mining (HMY).
