RBC Capital Downgrades Bemis Company to ‘Underperform’
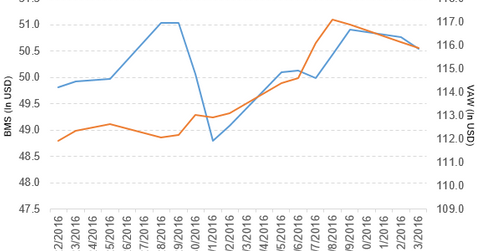
Bemis Company (BMS) has a market cap of $4.7 billion. It fell 0.43% to close at $50.55 per share on December 13, 2016.
Dec. 15 2016, Updated 9:05 a.m. ET

Price movement
Bemis Company (BMS) has a market cap of $4.7 billion. It fell 0.43% to close at $50.55 per share on December 13, 2016. The stock’s weekly, monthly, and year-to-date (or YTD) price movements were 0.84%, 5.8%, and 15.8%, respectively, on the same day.
BMS is trading 1.5% above its 20-day moving average, 2.5% above its 50-day moving average, and 0.73% above its 200-day moving average.
Related ETF and peers
The Vanguard Materials ETF (VAW) invests 0.68% of its holdings in Bemis. The YTD price movement of VAW was 24.6% on December 13.
The market caps of Bemis’s competitors are as follows:
BMS’s rating
On December 13, 2016, RBC Capital downgraded Bemis Company’s (BMS) rating to “underperform” from “sector perform.” It also reduced the stock’s price target to $46.00 from $49.00 per share.
Performance of Bemis Company in 3Q16
Bemis Company reported 3Q16 net sales of $1.03 billion, a rise of 1% compared to net sales of $1.02 billion in 3Q15. Compared to 3Q15, sales of US Packaging fell 4.7%, and sales of Global Packaging rose 12.7% in 3Q16.
The company’s gross profit margin and operating margin rose 10 basis points and 90 basis points, respectively, in 3Q16 compared to 2Q16.
Bemis Company’s net income and EPS (earnings per share) rose to $68.6 million and $0.72, respectively, in 3Q16 compared to $62.5 million and $0.64, respectively, in 3Q15. It reported adjusted EBITDA[1. earnings before interest, taxes, depreciation, and amortization] and adjusted EPS of $160.7 million and $0.75, respectively, in 3Q16. This is a rise of 8.3% and 11.9%, respectively, compared to 3Q15. Bemis’s cash and cash equivalents and inventories rose 33.6% and 8.1%, respectively, in 3Q16 compared to 4Q15.
