A Look at AT&T’s Value Proposition in the US Telecom Market
In this part of the series, we’ll look at some value-centric measures for AT&T (T) compared to the other major companies in the US wireless space.
Nov. 11 2016, Updated 10:04 a.m. ET

AT&T’s size
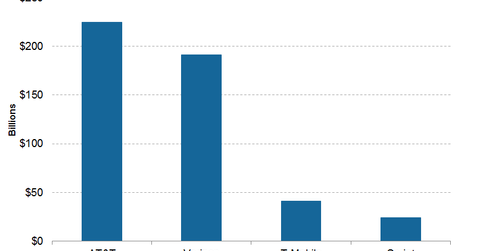
In this part of the series, we’ll look at some value-centric measures for AT&T (T) compared to the other major companies in the US wireless space. Let’s start with the sizes of the top four US wireless carriers: Verizon (VZ), AT&T, T-Mobile (TMUS), and Sprint (S).
As of November 3, 2016, AT&T was the largest US telecommunications (or telecom) player. Verizon was the second-largest player, and T-Mobile was the third-largest player by market capitalization. Sprint’s market capitalization was lower than T-Mobile’s.
AT&T’s valuation multiples
Price-based multiples take into account value from a shareholder’s perspective. EV-based (enterprise value) multiples help investors to understand the value of a company via its sources of capital from a shareholder’s point of view. These are forward multiples based on expected values after a year.
Let’s look at the earnings multiples for AT&T and its peers as of November 3, 2016. AT&T was trading at a forward PE (price-to-earnings) multiple of ~12.24x, higher than Verizon’s ~11.71x. AT&T’s forward EV-to-EBITDA (enterprise value to earnings before interest, tax, depreciation, and amortization) metric was ~6.28x, higher than Sprint’s and T-Mobile’s ~5.09x and ~6.06x, respectively.
AT&T’s dividend yield was ~5.4% as of November 3, 2016, higher than Verizon’s ~4.9% dividend yield.
In the next article of this series, we’ll look at analysts’ recommendations for AT&T’s stock.
