Free Cash Flow Trends: Are OFS Companies Burning Cash?
Many oilfield equipment and services (or OFS) companies’ cash flows have taken a beating following the energy price weakness in the past two years.
Nov. 20 2020, Updated 11:17 a.m. ET

Analyzing free cash flow trends in the OFS industry
Many oilfield equipment and services (or OFS) companies’ cash flows have taken a beating following the energy price weakness in the past two years.
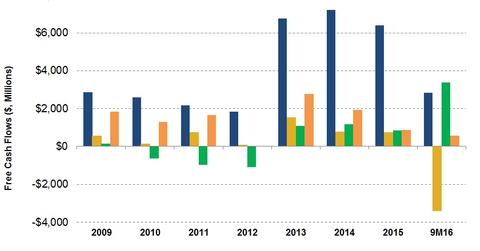
However, except for Halliburton (HAL), most large OFS companies managed to generate positive free cash flows (or FCF) in 2016. We’ll discuss the FCF trend in the OFS industry in this article. FCF is the excess of cash flow from operations (or CFO) over capital expenditure (or capex).
What does the largest OFS company’s FCF trend tell us?
Schlumberger’s (SLB) FCF rose 151% from 2009 to 2014. SLB’s CFO more than doubled from 2009 to 2014, led by revenue growth. Its capex rose less, by 66%, during the same period, resulting in an FCF rise.
From 2014 to 2015, SLB’s FCF fell 11% despite a sharp fall in capex. During the first nine months of 2016, SLB’s FCF fell sharply, as its CFO fell more sharply than its fall in capex.
Analyzing FCF trends for HAL, BHI, and NOV
Halliburton’s (HAL) FCF rose 44% from 2009 to 2014. HAL’s CFO rose 69% from 2009 to 2014, led by revenue growth. From 2014 to 2015, HAL’s FCF fell just 7%. During the first nine months of 2016, HAL’s FCF was -$3.4 billion, primarily because its CFO had also turned negative. This was led by its huge payment to Baker Hughes (BHI) related to a merger termination. Halliburton makes up 0.45% of the iShares S&P 500 ETF (IVE).
From 2010 to 2012, BHI burnt cash, as its capex exceeded its CFO. However, from 2013 to 2015, its FCF position improved, led by improved CFO. During the first nine months of 2016, BHI’s FCF stood in stark contrast to those of its industry peers, at $3.3 billion. This amount was due primarily to a merger termination–related payment from HAL. BHI makes up 1.7% of the iShares US Energy ETF (IYE).
National Oilwell Varco’s (NOV) FCF rise was a meager 4% from 2009 to 2014 due to its high capex growth (180%) during the period. In 2015, its FCF fell 54%, led by lower CFO. NOV’s CFO was much more resilient in the first nine months of 2016, and so was its FCF.
Next, we’ll discuss OFS companies’ indebtedness.
