A Look at Pool Corporation’s 3Q16 Performance
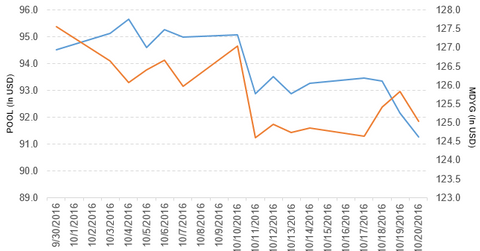
Pool Corporation (POOL) has a market cap of $3.8 billion. It fell 0.95% to close at $91.28 per share on October 20, 2016.
Oct. 21 2016, Updated 4:04 p.m. ET

Price movement
Pool Corporation (POOL) has a market cap of $3.8 billion. It fell 0.95% to close at $91.28 per share on October 20, 2016. The stock’s weekly, monthly, and year-to-date (or YTD) price movements were -1.7%, -2.4%, and 14.1%, respectively, on the same day.
POOL is trading 3.2% below its 20-day moving average, 5.8% below its 50-day moving average, and 1.9% above its 200-day moving average.
Related ETF and peers
The SPDR S&P 400 Mid Cap Growth ETF (MDYG) invests 0.59% of its holdings in POOL. The ETF tracks a market-cap-weighted index of growth companies culled from the S&P 400. The YTD price movement of MDYG was 6.2% on October 20.
The market caps of POOL’s competitors are as follows:
- Home Depot (HD): $155.8 billion
- Beacon Roofing Supply (BECN): $2.5 billion
Performance of POOL in 3Q16
POOL reported 3Q16 net sales of $691.4 million, a rise of 7.1% compared to $645.8 million in 3Q15. The company’s gross profit margin and operating margin rose 33 bps (basis points) and 59 bps, respectively, in 3Q16 compared to the prior year’s period.
Its net income and EPS (earnings per share) rose to $44.5 million and $1.03, respectively, in 3Q16 compared to $39.4 million and $0.90, respectively, in 3Q15. It reported adjusted EBITDA (earnings before interest, tax, depreciation, and amortization) of $83.0 million in 3Q16, a rise of 15.1% compared to fiscal 3Q15.
POOL’s cash and cash equivalents and product inventories rose 2.7% and 10.3%, respectively, in 3Q16 compared to the prior year’s period. Its current ratio fell to 2.2x, and its debt-to-equity ratio rose to 2.8x in 3Q16 compared to 2.7x and 2.6x, respectively, in 3Q15.
The company has projected EPS of $3.40–$3.46 for fiscal 2016.
Next, we’ll look at Sonoco Products (SON).
