Why Is Andrews & Springer Investigating Packaging Corporation of America?
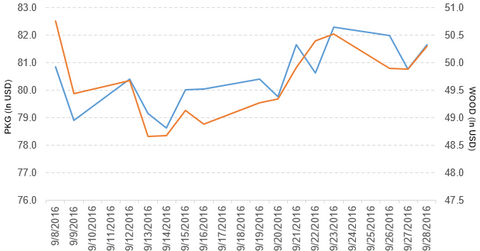
PKG rose 1.1% to close at $81.66 per share on September 28. Its weekly, monthly, and YTD price movements were 0.0%, 4.3%, and 32.9%.
Sept. 29 2016, Published 3:44 p.m. ET

Price movement
Packaging Corporation of America (PKG) has a market cap of $7.7 billion. It rose 1.1% to close at $81.66 per share on September 28, 2016. The stock’s weekly, monthly, and YTD (year-to-date) price movements were 0.0%, 4.3%, and 32.9%, respectively, on the same day.
PKG is now trading 2.2% above its 20-day moving average, 6.0% above its 50-day moving average, and 27.7% above its 200-day moving average.
Related ETF and peers
The iShares Global Timber & Forestry ETF (WOOD) invests 3.8% of its holdings in PKG. The ETF tracks the 25 largest publicly listed companies that own or manage forests and timberlands. The YTD price movement of WOOD was 5.3% on September 28.
The market caps of PKG’s competitors are as follows:
Latest news on PKG
In a press release on September 28, 2016, Andrews & Springer reported, “Andrews & Springer LLC, a boutique securities class action law firm focused on representing shareholders nationwide, is investigating a potential breach of fiduciary duty claims against Packaging Corporation of America (PKG).”
Performance in 2Q16
PKG reported 2Q16 net sales of ~$1.4 billion, which is a YoY (year-over-year) fall of 2.5% from its net sales of ~$1.5 billion in 2Q15. Sales from its Packaging and Paper segments fell 1.5% and 5.1% YoY, respectively, between 2Q15 and 2Q16. The company’s gross profit margin and income from operations rose 3.4% and 1.3% YoY, respectively.
Its net income and EPS (earnings per share) rose to $115.9 million and $1.23, respectively, in 2Q16, as compared to $114.0 million and $1.16 in 2Q15. It reported EBITDA (earnings before interest, tax, depreciation, and amortization) excluding special items of $290.4 million in 2Q16, which represents a YoY rise of 1.1%.
PKG’s capital spending fell 20.2%, and its cash balance rose 30.5% between 2Q15 and 2Q16.
Now let’s look at Skechers USA (SKX).
