Sony Announces New Plans for Future Growth
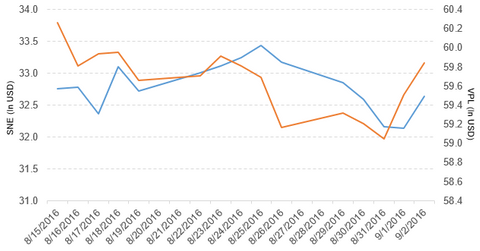
Sony fell by 1.6% to close at $32.64 per share during the fifth week of August, with weekly, monthly, and YTD price movements of -1.6%, 0.12%, and 32.6%.
Nov. 20 2020, Updated 12:34 p.m. ET

Price movement
Sony (SNE) fell by 1.6% to close at $32.64 per share during the fifth week of August 2016. The stock’s weekly, monthly, and YTD (year-to-date) price movements were -1.6%, 0.12%, and 32.6%, respectively, on the same day.
SNE is now trading 0.50% below its 20-day moving average, 4.4% above its 50-day moving average, and 23.3% above its 200-day moving average.
Related ETF and peers
The Vanguard FTSE Pacific ETF (VPL) invests 0.56% of its holdings in Sony. The ETF tracks the FTSE Developed Asia Pacific Index, a market-cap-weighted index of securities in the developed markets of the Pacific region. The YTD price movement of VPL was 6.7% on September 2.
The market caps of Sony’s competitors are as follows:
Latest news on Sony
In a press release, CNBC reported that “Sony has unveiled a 3,300 euro ($3,680) gold-plated Walkman music player as the Japanese electronics giant focuses on higher end products in its audio division.”
In another release, CNBC reported that “Sony unveiled its latest flagship smartphone—the Xperia XZ—Thursday as it looks to build on momentum in its mobile business, amid a continued turnaround at the electronics giant.”
The report added the following: “The Japanese firm, which is enjoying a turnaround in its fortunes, showed off two smartphones—the 5.2 inch Xperia XZ and the 4.6 inch Xperia X Compact—at the IFA consumer electronics show in Berlin on Thursday.”
In its next release, Sony reported that “Sony Pictures Home Entertainment (SPHE) and Intel Corporation today announced that ULTRA, SPHE’s 4K movie streaming service, will debut on computers powered by 7th Gen Intel® Core™ processors beginning Q1 in 2017.”
Performance in 1Q16
Sony reported 1Q16 sales and operating revenue of 1.6 trillion Japanese yen (about $16 billion)—a fall of 10.8%, as compared to sales and operating revenue of 1.8 trillion yen in 1Q15.
Sales and operating revenue from the company’s Mobile Communications, Imaging Products, and Solutions, Home Entertainment and Sound, Semiconductors, Components, and Financial Services segments fell by 33.9%, 26.4%, 7.0%, 21.4%, 22.8%, and 16.8%, respectively.
Sales and operating revenues from the company’s Game and Network Services, Pictures, and Music segments rose by 16.9%, 6.8%, and 8.7%, respectively, in 1Q16 over 1Q15. Sony reported a gain of 50.8 billion yen (about $498 million) on the sale of securities investments in 1Q16. The company’s operating income fell by 42.0% in 1Q16 from the same period last year.
Sony’s net income and EPS (earnings per share) fell to 21.2 billion yen (about $208 million) and 16.44 yen (about $0.16), respectively, in 1Q16, as compared to 82.4 billion yen (about $807 million) and 70.36 yen (about $0.69), respectively, in 1Q15.
Sony’s cash and cash equivalents fell by 35.8%, and its inventories rose by 5.1% in 1Q16 over 4Q15. Its current ratio fell to 0.85x and its DE (debt-to-equity) ratio rose to 4.34x in 1Q16, as compared to its current ratio and a DE ratio of 0.87x and 4.33x, respectively, in 4Q15.
Projections
The company made the following projections for 2016:
- sales and operating revenue of 7.4 trillion yen (about $72 billion)
- operating income of 300 billion yen (about $2.9 billion)
- income before income taxes of 270 billion yen (about $2.6 billion)
- net income of 80 billion yen (about $784 million)
- sales and operating revenue growth from Mobile Communications, Game and Network Services, Imaging Products and Solutions, Home Entertainment and Sound, Semiconductors, Components, Pictures, Music, and Financial Services segements of -25.5%, 2.5%, -21.1%, -13.7%, -5.3%, -11.0%, -1.9%, -11.0%, and 6.2%, respectively.
The above sales forecasts include the impact of foreign exchange rates and falls in the Mobile Communications, Pictures, and Game and Network Services segments’ sales.
Next, we’ll discuss B&G Foods (BGS).
