A Look at Energizer Holdings’ Performance in Fiscal 3Q16
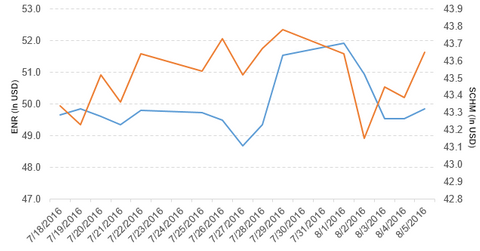
Energizer Holdings (ENR) fell by 3.3% to close at $49.85 per share during the first week of August 2016.
Aug. 9 2016, Published 3:42 p.m. ET

Price movement
Energizer Holdings (ENR) fell by 3.3% to close at $49.85 per share during the first week of August 2016. The stock’s weekly, monthly, and year-to-date (or YTD) price movements were -3.3%, 0.12%, and 48.1%, respectively, as of August 5.
ENR is trading 0.29% below its 20-day moving average, 0.64% above its 50-day moving average, and 21.5% above its 200-day moving average.
Related ETFs and peers
The Schwab US Mid-Cap ETF (SCHM) invests 0.13% of its holdings in Energizer. The ETF tracks a market cap–weighted index of mid-cap stocks in the Dow Jones US Total Stock Market Index. The YTD price movement of SCHM was 9.7% on August 5.
The SPDR S&P 400 Mid-Cap Value ETF (MDYV) invests 0.22% of its holdings in Energizer. The ETF tracks a market cap–weighted index of US stocks. The index uses three factors to select value stocks from the 400 stocks chosen by the S&P Committee.
The market caps of Energizer Holdings’ competitors are as follows:
Performance of Energizer Holdings in fiscal 3Q16
Energizer Holdings reported fiscal 3Q16 net sales of $361.0 million, a fall of 3.6% compared to its net sales of $374.3 million in fiscal 3Q15. Sales in its Latin America, EMEA (Europe, the Middle East, and Africa), and Asia-Pacific segments fell by 6.8%, 6.2%, and 11.9%, respectively, and sales in its North America segment rose by 1.7% in fiscal 3Q16 compared to fiscal 3Q15.
The company’s gross profit margin fell by 6.7% in fiscal 3Q16, compared to the prior year’s period. It reported spin restructuring of $0.9 million in fiscal 3Q16, compared to $11.7 million in fiscal 3Q15.
Its net income and EPS (earnings per share) rose to $24.2 million and $0.39, respectively, in fiscal 3Q16, compared to -$19.6 million and -$0.32, respectively, in fiscal 3Q15. It reported adjusted EBITDA (earnings before interest, taxes, depreciation, and amortization) and adjusted EPS of $56.2 million and $0.32, respectively, in fiscal 3Q16, falls of 28.9% and 50.0%, respectively, compared to fiscal 3Q15.
Energizer’s cash and cash equivalents rose by 12.9%, and its inventories fell by 15.9% in fiscal 3Q16 compared to fiscal 4Q15. Its current ratio rose to 2.6x in fiscal 3Q16, compared to 2.3x in fiscal 4Q15.
Quarterly dividend
Energizer Holdings has declared a quarterly dividend of $0.25 per share on its common stock. The dividend will be paid on September 9, 2016, to shareholders of record at the close of business on August 19, 2016.
The company has also planned to increase its quarterly dividend by 10% to $0.28 per share on its common stock from the beginning of fiscal 2017.
Projections
Energizer Holdings has made the following projections for 2016:
- net sales to fall in the low single digits
- organic net sales to rise in the low single digits
- $60 million–$70 million negative impact on net sales from foreign currency movements
- international go-to-market changes to reduce net sales in the low single digits
- deconsolidation of Venezuela results to reduce net sales by $8.5 million
- gross margin rates to fall by 2.5% due to unfavorable currency impacts, the impact of the Venezuela deconsolidation, and investments in product improvements and productivity initiatives
- an income tax rate of 29%–30%
- adjusted EBITDA of $280 million–$300 million
- free cash flow exceeding $150 million
- spin and restructuring costs of $17 million–$20 million
The company has projected the following from its acquisition of HandStands:
- accretion to adjusted EPS in the range of $0.04–$0.05 for fiscal 4Q16
- total acquisition- and integration-related costs due to the acquisition in the range of $30 million–$35 million, incurred over the next 12–15 months
- non-cash inventory step-up accounting adjustment in the range of $8 million–$9 million
Now let’s discuss Avery Dennison (AVY).
