Where Do FMC’s Valuations Stand after Its 2Q16 Earnings?
Forward price-to-earnings (or PE) is a relative valuation method that considers a company’s future earnings for calculation.
Aug. 12 2016, Updated 11:04 a.m. ET

FMC’s forward price-to-earnings
Forward price-to-earnings (or PE) is a relative valuation method that considers a company’s future earnings for calculation.
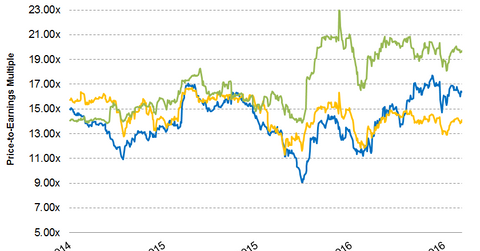
In the past two years, FMC Corporation (FMC) has been trading at a one-year forward PE multiple in the range of 9.10x–17.70x. As of August 5, 2016, FMC was trading at a one-year forward PE multiple of 16.40x. Its peers Dow Chemical (DOW) and DuPont (DD) were trading at one-year forward PE multiples of 14.10x and 19.70x, respectively.
After FMC reported its 2Q16 earnings, its forward PE remained flat at 16.40x. Analysts expect its next-12-month EPS (earnings per share) to be at $2.70, compared to $2.83 before its earnings. In contrast to this falling expectation, FMC’s stock price rose by 3.3%, so its forward PE remained flat.
The forward PE ratio tells us how much investors are paying per dollar of a company’s expected earnings for the next 12 months. Using this ratio, investors can compare between two or more companies that operate in the same industry and decide which stock is overvalued or undervalued.
However, PE ratio is just one of many valuation metrics, and a decision shouldn’t be made to buy or sell a stock based only on this metric due to its other limitations.
EV-to-EBITDA
The EV-to-EBITDA (enterprise value to earnings before interest, tax, depreciation, and amortization) multiple is an important relative valuation multiple that’s widely used in capital-intensive industries such as the chemical industry. This multiple considers debt for calculation, so it’s a better metric than the PE ratio.
As of August 5, 2016, FMC’s one-year forward EV-to-EBITDA stood at 10.80x. Its peers DOW’s and DD’s forward EV-to-EBITDAs were 8.0x and 11.1x, respectively. This multiple is calculated based on the company’s estimated EBITDA for the next 12 months.
Peer comparison
FMC is trading at a premium compared to Dow Chemical, and it’s trading at a marginal discount to DuPont. In its latest earnings report, FMC showed its ability to reduce operational costs, and it managed to increase its margins despite lower-than-expected revenue.
The company is also more optimistic about its Lithium segment’s growth. It plans to triple its production capacity to 30,000 metric tons by 2019 to meet growing demand. All these factors have helped FMC to trade at a premium.
Investors can hold FMC indirectly by investing in the Materials Select Sector SPDR ETF (XLB) and the SPDR S&P North American Natural Resources ETF (NANR). These ETFs had invested 1.3% and 0.95% of their portfolios, respectively, in FMC as of August 8, 2016.
