AptarGroup’s Top and Bottom Lines Rose in 2Q16
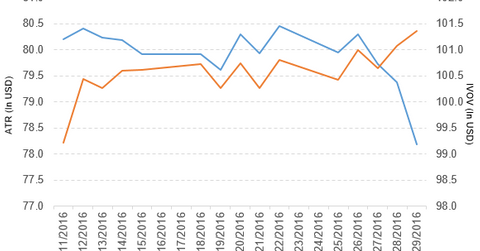
AptarGroup (ATR) fell by 2.5% to close at $78.18 per share during the fourth week of July 2016.
Aug. 1 2016, Published 3:51 p.m. ET

Price movement
AptarGroup (ATR) fell by 2.5% to close at $78.18 per share during the fourth week of July 2016. The stock’s weekly, monthly, and year-to-date (or YTD) price movements were -2.5%, 2.3%, and 8.9%, respectively, as of July 29. ATR is trading 1.7% below its 20-day moving average, 0.62% above its 50-day moving average, and 5.0% above its 200-day moving average.
Related ETF and peers
The Vanguard S&P Mid-Cap 400 Value ETF (IVOV) invests 0.27% of its holdings in AptarGroup. The ETF tracks an index of primarily mid-cap US stocks. The index uses three factors to select value stocks from the 400 stocks chosen by the S&P Committee. The YTD price movement of IVOV was 14.7% on July 29.
The market caps of AptarGroup’s competitors are as follows:
Performance of AptarGroup in 2Q16
AptarGroup reported 2Q16 net sales of $620.0 million, a rise of 4.3% from the net sales of $594.3 million in 2Q15. Sales of the beauty & home and pharma segments rose by 6.6% and 4.2%, respectively, and sales of the food & beverage segments fell by 3.6% between 2Q15 and 2Q16. The company’s operating income fell by 2.0% in 2Q16.
Its net income and EPS (earnings per share) rose to $59.1 million and $0.91, respectively, in 2Q16, compared with $57.5 million and $0.90, respectively, in 2Q15. It reported adjusted EBITDA (earnings before interest, tax, depreciation, and amortization) of $133.5 million in 2Q16, a rise of 10.7% from 2Q15.
AptarGroup’s cash and cash equivalents fell by 26.2% and its inventories rose by 10.4% between 4Q15 and 2Q16. Its current ratio and debt-to-equity ratio fell to 2.5x and 1.10x, respectively, in 2Q16, compared with $3.1x and 1.12x in 4Q15. For fiscal 3Q16, the company projected EPS in the range of $0.79 to $0.84, which excludes the impact of costs incurred and any insurance-related reimbursements with the Aptar Annecy facility fire.
In the next part, we’ll take a look at Tootsie Roll Industries.
