Wabco Holdings Enjoyed Top and Bottom Line Growth in 2Q16
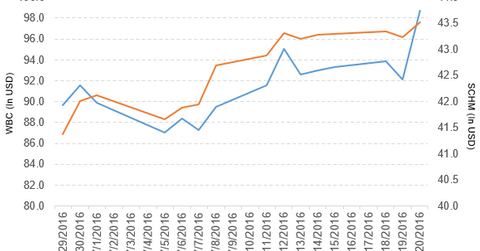
Wabco Holdings (WBC) has a market cap of $5.5 billion. It rose by 7.2% to close at $98.72 per share on July 20, 2016.
July 21 2016, Updated 5:23 p.m. ET

Price movement
Wabco Holdings (WBC) has a market cap of $5.5 billion. It rose by 7.2% to close at $98.72 per share on July 20, 2016. The stock’s weekly, monthly, and year-to-date (or YTD) price movements were 6.6%, -7.5%, and -3.5%, respectively, on the same day.
WBC is trading 5.8% above its 20-day moving average, 1.9% below its 50-day moving average, and 2.9% below its 200-day moving average.
Related ETF and peers
The Schwab US Mid-Cap ETF (SCHM) invests 0.22% of its holdings in Wabco. The ETF tracks a market-cap-weighted index of mid-cap stocks in the Dow Jones US Total Stock Market Index. The YTD price movement of SCHM was 9.4% on July 20, 2016.
The market caps of Wabco’s competitors are as follows:
Performance of Wabco in 2Q16
Wabco Holdings reported 2Q16 sales of $732.2 million, a rise of 10.8% compared to sales of $661.1 million in 2Q15. The company’s gross profit margin and operating income rose by 0.08% and 20.2%, respectively, in 2Q16 compared to the prior year period.
Its net income and EPS (earnings per share) rose to $75.1 million and $1.33, respectively, in 2Q16 compared to $65.8 million and $1.12, respectively, in 2Q15. It reported EPS on a performance basis of $1.43 in 2Q16, a rise of 2.1% compared to 2Q15.
WBC’s cash and cash equivalents and inventories rose by 16.3% and 14.7%, respectively, in 2Q16 compared to 4Q15. Its current ratio fell to 2.96x, and its debt-to-equity ratio rose to 2.5x in 2Q16. This compares to a current ratio and debt-to-equity ratio of 2.98x and 2.1x, respectively, in 4Q15.
During 2Q16, the company repurchased 626,200 shares worth $64.3 million. It authorized to repurchase shares worth up to $124.0 million through December 31, 2016.
Projections
The company has made the following projections for fiscal 2016:
- sales of $2.8 billion–$2.9 billion
- sales growth of 7%–10% in local currencies
- on a performance basis, operating margin of 13.5%–14.0% and diluted EPS of $5.60–$5.90
- on a reported basis, operating margin of 12.4%–12.9% and diluted EPS of $3.73–$4.03
This guidance includes the non-cash tax expense due to the European Commission’s decision in January 2016 against the Belgian tax authority.
Now we’ll take a look at Harman International Industries (HAR).
