Why Did Brunswick Corporation Acquire Thunder Jet?
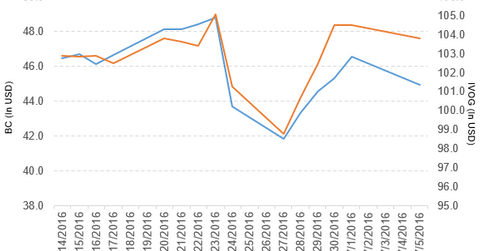
Brunswick Corporation (BC) has a market cap of $4.1 billion. Its stock fell by 3.4% to close at $44.95 per share on July 5, 2016.
Nov. 20 2020, Updated 12:00 p.m. ET

Brunswick’s price movement
Brunswick Corporation (BC) has a market cap of $4.1 billion. Its stock fell by 3.4% to close at $44.95 per share on July 5, 2016. The stock’s weekly, monthly, and YTD (year-to-date) price movements were 7.5%, -3.9%, and -10.4%, respectively, on the same day. BC is trading 3.1% below its 20-day moving average, 4.7% below its 50-day moving average, and 4.9% below its 200-day moving average.
Related ETFs and peers
The Vanguard S&P Mid-Cap 400 Growth ETF (IVOG) invests 0.60% of its holdings in Brunswick. The ETF tracks a market cap–weighted index of growth companies culled from the S&P 400. The YTD price movement of IVOG was 4.9% on July 5.
The iShares Dow Jones U.S. ETF (IYY) invests 0.02% of its holdings in Brunswick. The ETF tracks a broad, cap-weighted index of US companies covering 95% of the US market.
The market caps of Brunswick’s competitors are as follows:
Brunswick’s new acquisition
Brunswick Corporation has acquired Thunder Jet, a designer and builder of heavy-gauge aluminum boats. The terms of this acquisition are not disclosed.
The company also noted, “With a current portfolio of 18 models ranging in length from 18-26 feet, Thunder Jet will operate as a key part of the Freshwater Boat division of the Brunswick Boat Group (BBG), adding breadth and depth to BBG’s overall product portfolio.”
This acquisition will provide a market share in the niche market where boat and marine engine brands are currently underrepresented and will increase Brunswick’s top line in the Boat and Marine Engine segments.
Brunswick’s performance in fiscal 1Q16
Brunswick (BC) reported fiscal 1Q16 net sales of $1.1 billion, a rise of 8.6% over the net sales of $985.7 million in fiscal 1Q15. Sales of its Marine Engine, Boat, and Fitness segments rose by 5.9%, 5.9%, and 17.6%, respectively, in fiscal 1Q16 as compared to fiscal 1Q15.
In fiscal 1Q16, the company’s net income and EPS (earnings per share) rose to $64.8 million and $0.70, respectively, compared with $57.0 million and $0.60, respectively, in fiscal 1Q15.
Brunswick’s cash and cash equivalents fell by 57.1%, and its inventories rose by 7.6% in fiscal 1Q16, as compared to fiscal 4Q15. In fiscal 1Q16, its current and debt-to-equity ratios fell to 1.8x and 1.4x, respectively, as compared with 2.0x and 1.5x in fiscal 4Q15.
Projections
Brunswick (BC) made the following projections for fiscal 2016:
- revenue growth of 9%–11%, which includes the acquisition of Cybex
- adjusted EPS in the range of $3.40–$3.50, as compared to the previous guidance of $3.35–$3.50
- positive free cash flow of more than ~$200 million
For an ongoing analysis of this sector, please visit Market Realist’s Consumer Discretionary page.
