Why Did Brunswick Change Its Revolving Credit Facility?
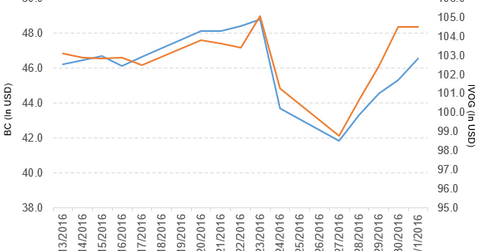
Brunswick (BC) rose by 6.6% to close at $46.54 per share at the end of the fifth week of June 2016.
Nov. 20 2020, Updated 3:36 p.m. ET

Price movement of Brunswick
Brunswick (BC) rose by 6.6% to close at $46.54 per share at the end of the fifth week of June 2016. The stock’s weekly, monthly, and year-to-date (or YTD) price movements were 6.6%, -2.6%, and -7.2%, respectively. BC is trading 0.31% above its 20-day moving average, 1.4% below its 50-day moving average, and 1.5% below its 200-day moving average.
Related ETFs and peers
The Vanguard S&P Mid-Cap 400 Growth ETF (IVOG) invests 0.60% of its holdings in Brunswick. The ETF tracks a market-cap-weighted index of growth companies culled from the S&P 400. The YTD price movement of IVOG was 5.6% on July 1.
The iShares Dow Jones US Consumer Goods Sector Index ETF (IYK) invests 0.20% of its holdings in Brunswick. The ETF tracks a market-cap-weighted index of stocks in the US consumer goods sector. The market caps of Brunswick’s competitors are as follows:
Brunswick updates its credit facility
In a press release on June 30, 2016, Brunswick announced “that it and a group of financial institutions have amended and extended the Company’s revolving credit facility. The extended facility will be in effect through June 2021, and remains at $300 million providing Brunswick more favorable terms in light of its strong operating performance and credit profile.”
This new updated credit facility will provide adequate levels of credit availability, increase flexibility, and support its current strong cash position.
Performance of Brunswick in fiscal 1Q16
Brunswick (BC) reported fiscal 1Q16 net sales of $1.1 billion, a rise of 8.6% over the net sales of $985.7 million in fiscal 1Q15. Sales of its Marine Engine, Boat, and Fitness segments rose by 5.9%, 5.9%, and 17.6%, respectively, between fiscals 1Q15 and 1Q16.
In fiscal 1Q16, the company’s net income and EPS (earnings per share) rose to $64.8 million and $0.70, respectively, compared with $57.0 million and $0.60, respectively, in fiscal 1Q15.
Brunswick’s cash and cash equivalents fell by 57.1% and its inventories rose by 7.6% between fiscals 4Q15 and 1Q16. In fiscal 1Q16, its current and debt-to-equity ratios fell to 1.8x and 1.4x, respectively, compared with 2.0x and 1.5x in fiscal 4Q15.
Projections
Brunswick (BC) made the following projections for fiscal 2016:
- revenue growth of 9%–11%, which includes the acquisition of Cybex
- adjusted EPS in the range of $3.40–$3.50 from $3.35–$3.50
- positive free cash flow of more than ~$200 million
For an ongoing analysis of this sector, please visit Market Realist’s Consumer Discretionary page.
