Bank of America-Merrill Lynch Downgrades WABCO to ‘Neutral’
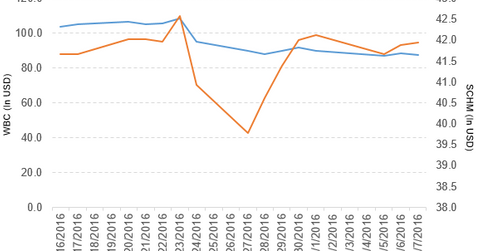
WABCO Holdings fell by 1.3% to close at $87.26 per share on July 7. The stock’s weekly, monthly, and YTD price movements were -2.7%, -20.3%, and -14.7%.
July 8 2016, Published 5:02 p.m. ET

Price movement
WABCO Holdings (WBC) has a market cap of $5 billion. It fell by 1.3% to close at $87.26 per share on July 7, 2016. The stock’s weekly, monthly, and YTD (year-to-date) price movements were -2.7%, -20.3%, and -14.7%, respectively, on the same day. This means that WBC was trading 12.4% below its 20-day moving average, 16.1% below its 50-day moving average, and 14.7% below its 200-day moving average.
Related ETF and peers
The Schwab US Mid-Cap ETF (SCHM) invests 0.22% of its holdings in WABCO. The ETF tracks a market-cap-weighted index of mid-cap stocks in the Dow Jones US Total Stock Market Index. The YTD price movement of SCHM was 5.4% on July 7.
The market caps of WABCO’s competitors are as follows:
Performance of WABC in fiscal 1Q16
Bank of America-Merrill Lynch has downgraded WABCO Holdings to “neutral” from “buy.” WABCO Holdings reported fiscal 1Q16 sales of $688.7 million, a rise of 5.6% as compared to its sales of $652.2 million in fiscal 1Q15. The company’s gross profit margin fell by 5.2%, and its operating income rose 1.8% in fiscal 1Q16 over 1Q15.
WABCO’s net income and EPS (earnings per share) fell to -$13.4 million and -$0.24, respectively, in fiscal 1Q16, as compared to $71.9 million and $1.22, respectively, in fiscal 1Q15.
WBC’s cash and cash equivalents and inventories rose 23.6% and 16.5%, respectively, in fiscal 1Q16 compared to fiscal 4Q15. Its current ratio and debt-to-equity ratio rose to 3.1x and 2.4x, respectively, in fiscal 1Q16, as compared to 3.0x and 2.1x, respectively, in fiscal 1Q15. It reported performance free cash flow of $68.3 million in fiscal 1Q16, a rise of 10.1% over fiscal 1Q15.
Projection
The company has made the following projections for fiscal 2016:
- sales growth in the range of 6%–11% in local currencies
- on a performance basis, an operating margin in the range of 13.8%–14.3% and diluted EPS in the range of $5.30–$5.80
- on a US GAAP basis, an operating margin in the range of 12.7%–13.2% and diluted EPS in the range of $3.43–$3.93 (including the non-cash tax expense due to the European Commission’s decision in January 2016 against the Belgian tax authority)
In the next part, we’ll discuss Sealed Air Corporation (SEE).
