Moody’s Upgrades WestRock’s Rating to Baa2
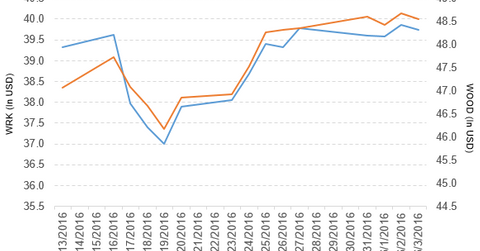
WestRock’s (WRK) stock fell by 0.10% to close at $39.74 per share in the first week of June 2016.
June 7 2016, Updated 9:08 a.m. ET

WestRock’s price movement
WestRock’s (WRK) stock fell by 0.10% to close at $39.74 per share in the first week of June 2016. The stock’s weekly, monthly, and YTD (year-to-date) price movements were 1.1%, 2.0%, and -11.0%, respectively. WRK is trading 0.29% below its 20-day moving average, 1.4% above its 50-day moving average, and 9.4% below its 200-day moving average.
Related ETF and peers
The iShares Global Timber & Forestry ETF (WOOD) invests 3.1% of its holdings in WestRock. The ETF tracks the 25 largest publicly listed companies that own or manage forests and timberlands. The YTD price movement of WOOD was 1.6% as of June 3, 2016.
The market caps of WestRock’s competitors are as follows:
Moody’s upgrades WestRock’s rating
Moody’s Investors Service has upgraded WestRock’s senior unsecured rating from Baa3 to Baa2. Moody’s has given WestRock a stable rating outlook.
This upgrade reflects the integration of operations of Rock-Tenn Company and MeadWestvaco Corporation with WestRock and the adjusted debt-to-EBITDA (earnings before interest, tax, depreciation, and amortization) ratio of 2.5x–2.7x.
WestRock’s performance in fiscal 2Q16
WestRock reported fiscal 2Q16 net sales of $3,696.6 million, a rise of 50.5% compared to net sales of $2,455.6 million in fiscal 2Q15. Sales from the corrugated packaging and consumer packaging segments rose by 7.4% and 128.6%, respectively, in 2Q16 compared to the corresponding period last year. The company reported sales of specialty chemicals and land and development of $203.9 million and $18.7 million, respectively, in 2Q16. The company reported restructuring and other costs of $131.2 million in 2Q16, compared to $17.2 million in 2Q15.
Its net income and EPS (earnings per share) fell to $56.9 million and $0.22, respectively, in 2Q16, compared to $109.8 million and $0.77, respectively, in 2Q15. The company reported adjusted EPS of $0.61 in fiscal 2Q16.
WestRock’s cash and cash equivalents and inventories rose by 61.0% and 4.9%, respectively, in 2Q16 compared to 4Q15. Its current ratio fell to 1.7x, and its debt-to-equity ratio rose to 1.3x in 2Q16, compared to a current ratio and a debt-to-equity ratio of 1.9x and 1.2x, respectively, in 4Q15.
In the next part of this series, we’ll look at Toyota Motor Company’s development plans.
