Why Goldman Sachs and Piper Jaffray Downgraded WABCO to ‘Neutral’
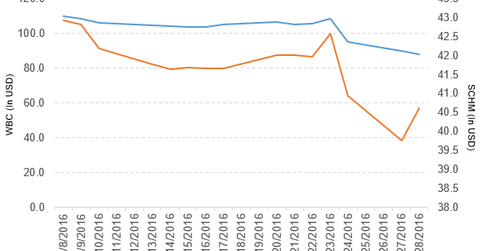
WABCO Holdings (WBC) has a market cap of $5.0 billion. It fell 2.0% to close at $88.07 per share on June 28.
June 29 2016, Published 5:39 p.m. ET

Price movement: WABCO
WABCO Holdings (WBC) has a market cap of $5.0 billion. It fell 2.0% to close at $88.07 per share on June 28. The stock’s weekly, monthly, and year-to-date (or YTD) price movements were -16.3%, -16.9%, and -13.9%, respectively, on the same day.
WBC is trading 16.4% below its 20-day moving average, 17.4% below its 50-day moving average, and 14.5% below its 200-day moving average.
Related ETF and peers
The Schwab US Mid-Cap ETF (SCHM) invests 0.22% of its holdings in WABCO. The ETF tracks a market-cap-weighted index of midcap stocks in the Dow Jones US Total Stock Market Index. The YTD price movement of SCHM was 2.1% on June 28.
The market caps of WABCO’s competitors are as follows.
WABCO’s rating
Goldman Sachs has downgraded WABCO Holdings to ‘neutral’ from ‘buy’ and also reduced the stock price target to $105.0 from $135.0 per share.
Piper Jaffray also downgraded WABCO Holdings to ‘neutral’ from ‘overweight’ and also reduced the stock price target to $94.0 from $124.0 per share.
Performance of WABCO in fiscal 1Q16
WABCO Holdings reported fiscal 1Q16 sales of $688.7 million, a rise of 5.6% compared to sales of $652.2 million in fiscal 1Q15. The company’s gross profit margin fell 5.2%, and its operating income rose 1.8% in fiscal 1Q16 compared to the prior year period.
Its net income and EPS (earnings per share) fell to -$13.4 million and -$0.24, respectively, in fiscal 1Q16 compared to $71.9 million and $1.22, respectively, in fiscal 1Q15.
WBC’s cash and cash equivalents and inventories rose 23.6% and 16.5%, respectively, in fiscal 1Q16 compared to fiscal 4Q15. Its current ratio and debt-to-equity ratio rose to 3.1x and 2.4x, respectively, in fiscal 1Q16 compared to 3.0x and 2.1x, respectively, in fiscal 1Q15. It reported performance free cash flow of $68.3 million in fiscal 1Q16, a rise of 10.1% from fiscal 1Q15.
Projection
The company has made the following projections for fiscal 2016:
- sales growth in the range of 6% to 11% in local currencies
- on a performance basis, it expects operating margin in the range of 13.8% to 14.3% and diluted EPS in the range of $5.30 to $5.80
- on a US GAAP basis, it expects operating margin in the range of 12.7% to 13.2% and diluted EPS in the range of $3.43 to $3.93, which includes the non-cash tax expense due to the European Commission’s decision in January 2016 against the Belgian tax authority
In the next part of this series, we’ll discuss Blue Buffalo Pet Products (BUFF).
