How Has Walmart’s Profitability Dip Affected Its Outlook?
Walmart’s reported operating income margin declined from 5.6% in fiscal 2015 to 5.0% in fiscal 2016.
Nov. 22 2019, Updated 7:01 a.m. ET

Walmart’s operating income hit by store closures
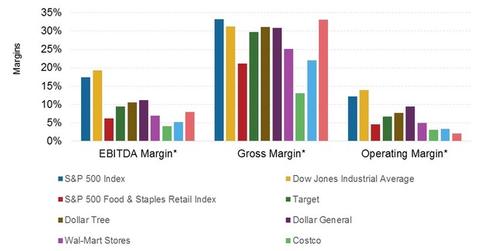
Wal-Mart Stores’ (WMT), or Walmart’s, operating income declined by 11.2% to $24.1 billion in fiscal 2016. The decrease was primarily due to lower sales resulting from forex (foreign exchange) headwinds, which we discuss in Parts 1 and 2 of this series, as well as the impact of the 269 store closures, investments in digital, and announced wage increases and training costs for staff. As a result, Walmart’s reported operating income margin declined from 5.6% in fiscal 2015 to 5.0% in fiscal 2016.
Merchandising margins up
The negative growth in operating income offset benefits the company saw on the merchandise margins side. Walmart increased its gross profit rate by 29 basis points to 24.6% in fiscal 2016, but the increase in profitability came about in the Walmart US and Walmart International segments, which saw gross profit rates rise by 12 basis points and 23 basis points, respectively, for the full year. The gross profit rate for Sam’s Club expanded by 30 basis points on lower fuel sales.
Improvement in profitability came about in the food, general merchandise, and consumables categories. Profitability was also helped by lower energy prices, which reduced transportation costs. Walmart’s discounting policies during the holiday season also helped margins on a YoY (year-over-year) comparable basis (based on comments by Greg Foran, CEO of Walmart US).
Walmart International has also started a cost analytics program in Canada and the UK. The program is focused on providing greater cost visibility to its buyers, helping them in negotiating better terms with suppliers. The company plans on rolling out the program to more markets in the future (based on comments by David Cheesewright, CEO of Walmart International).
Peer group comparisons
Walmart’s gross margin came in at 25.1% in fiscal 2016, up 30 basis points YoY. That’s higher than 21.1% for the S&P 500 Food & Staples Retail Index (XLP) (FXG) (VDC) in the trailing-twelve-month period. However, Walmart trails Publix Supermarkets’ (PUSH) 28.0%, Target’s (TGT) 29.7%, Dollar Tree’s (DLTR) 31.1%, and Dollar General’s (DG) 30.9%. Walmart’s margin is higher than the Kroger Company’s (KR) 22.1%, and Costco Wholesale Corporation’s (COST) 13.1%. Most of the variances are attributable to differences in the respective companies’ business models.
Walmart, Costco, Kroger, Target, Dollar Tree, and Dollar General together constitute 7.3% of the total portfolio holdings of the SPDR S&P Retail ETF (XRT).
Now let’s analyze Walmart’s costs and profitability outlook.
