Energizer Revenue and Income Rose in Fiscal 1Q16
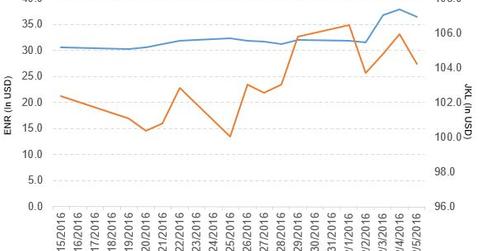
Energizer Holdings (ENR) rose by 13.7% to close at $36.43 per share at the end of the first week of February 2016.
Feb. 8 2016, Published 1:28 p.m. ET

Price movement of Energizer Holdings
Energizer Holdings (ENR) rose by 13.7% to close at $36.43 per share at the end of the first week of February 2016. The price movement on a weekly, monthly, and year-to-date (or YTD) basis is 13.7%, 6.1%, and 7.0%, respectively.
At times, the stock has broken the support of all moving day averages. Currently, ENR is trading 13.3% above its 20-day moving average, 8.6% above its 50-day moving average, and 3.0% below its 200-day moving average.
The iShares Morningstar Small Value ETF (JKL) invests 0.47% of its holdings in Energizer. The ETF tracks a market-cap-weighted index of US small-cap value stocks. The index includes stocks from the 90th to the 97th percentile of the market cap spectrum. The YTD price movement of JKL is -7.7% as of February 4, 2016.
The Schwab US Mid-Cap ETF (SCHM) invests 0.32% of its holdings in Energizer. The ETF tracks a market-cap-weighted index of mid-cap stocks in the Dow Jones US Total Stock Market Index.
The market caps of Energizer’s competitors are as follows:
Performance of Energizer Holdings in fiscal 1Q16
Energizer reported fiscal 1Q16 net sales of $506.8 million, a rise of 1.1% compared to net sales of $501.3 million in fiscal 1Q15. Net sales of the company’s North America region rose by 11.1% and net sales for its Latin America, EMEA, and Asia Pacific regions fell by 9.9%, 6.4%, and 12.3%, respectively, in fiscal 1Q16 compared to fiscal 1Q15.
Its net income and EPS (earnings per share) rose to $65.5 million and $1.05, respectively, in fiscal 1Q16, compared to $61.7 million and $0.99, respectively, in fiscal 1Q15.
Meanwhile, its cash and cash equivalents rose by 10.8%, and inventories fell by 24.2% in fiscal 1Q16 compared to fiscal 4Q15. Its current ratio rose to 2.4 in fiscal 1Q16 compared to 2.3 in fiscal 4Q15.
The company has declared a quarterly dividend of $0.25 per share on its common stock. The dividend will be paid on March 16, 2016, to shareholders of record at the close of business on February 19, 2016.
Projections
The company has made the following projections for fiscal 2016:
- Net sales are expected to be flat to up in the low-single digits. This projection includes the negative impact of foreign currency movement, international go-to-market changes, and changes in the Venezuela results due to deconsolidation.
- Gross margin rates are expected to decline up to 2.5%.
- The income tax rate will be in the range of 30% to 31%.
- Adjusted EBITDA (earnings before interest, tax, depreciation, and amortization) will be in the range of $275 million to $295 million.
- Free cash flow is expected to be $150 million.
- Adjusted EPS will be in the range of $1.90 to $2.10.
