An essential analysis of ExxonMobil’s balance sheet
On a combination of several factors such as its earnings, share buybacks, and XTO acquisition, XOM’s balance sheet has grown.
Nov. 20 2020, Updated 12:04 p.m. ET

ExxonMobil’s balance sheet
In a previous series, we discussed Why ExxonMobil (XOM) should be in your energy portfolio. This series takes a deeper look into the company’s financial statements to find out what’s special about the company’s fundamentals.
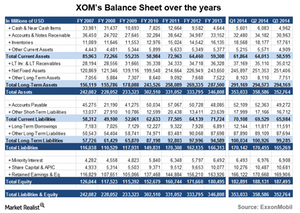
Kicking off our analysis of XOM’s financial statements, we’ll first see how its balance sheet has evolved over the last seven years.
Assets
ExxonMobil’s assets have grown about 45% from ~$242 billion in 2007 to ~$353 billion at the end of 3Q14. In comparison, Chevron (CVX) had a balance sheet size of ~$265 billion at the end of the same period. Both US integrated energy companies constitute a combined ~37% of the iShares US Energy ETF (IYE).
International peers Royal Dutch Shell (RDS.A) and BP Plc (BP) had total assets of ~$360 billion and ~$310 billion, respectively, at the end of 3Q14.
Two items that deserve a mention in XOM’s assets are a sharp drop in its cash and a jump in its assets. The first item has mainly been a consequence of the company standing pat on its dividends and also buying back shares during the worst days of the financial crisis. Low crude prices severely reduced its earnings during this period. This is a classic example of why a fundamentally sound company like XOM is a great company to weather inevitable business or economic cycles and the vagaries of commodity markets. The second item is mainly a consequence of XOM’s seminal, albeit ill-timed, acquisition of XTO Energy in 2010. The effect of this event reverberates across XOM’s balance sheet.
Liabilities and equity
Items deserving comment on XOM’s liabilities are its relatively steady long-term debt and payables. The former points to an earnings-fueled expansion in its assets, while the latter points to superior working capital management. We’ll explore this latter topic in some detail in the next part of this series.
On a combination of several factors such as its earnings, share buybacks, and XTO acquisition, XOM’s balance sheet has grown from ~$126 billion in 2007 to ~$187 billion at the end of 3Q14.
