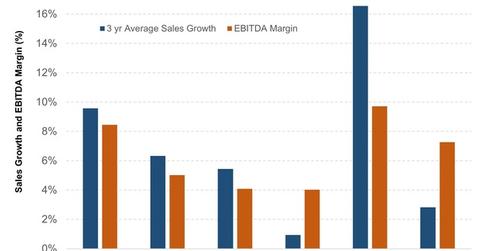
Whole Foods’ Low Sales Growth versus Impressive Margins
Whole Foods’ sales for fiscal 2015 earned $15.3 billion—a 8.4% rise over the previous fiscal year, and a 9.6% average rise over the past three fiscal years.
Nov. 24 2015, Updated 9:34 p.m. ET

Top-line growth ahead of competitors
Whole Foods Market’s (WFM) sales for fiscal 2015, which for the company ended on September 27, 2015, stood at $15.3 billion, showing an increase of 8.4% from the previous fiscal year. The company’s sales have grown by an average of 9.6% over the past three fiscal years.
Although the sales growth is higher than the three-year average sales growth for its competitors like Kroger Company (KR), which saw a 6.3% average growth, Costco Wholesale Corporation (COST), which saw a 5.4% average growth, and Wal-Mart Stores (WMT), which saw a 2.8% average growth during the same period. However, Whole Foods most recent performance in fiscal 2015 did not reach its past performance levels. Whole Foods’ top-line grew by an average of 15% between 2005 and 2013, after which time the company began to struggle with its top-line performance.
EBITDA margin continues to be impressive
Whole Foods has, on the other hand, been able to maintain one of the best EBITDA margins (earnings before interest taxes, depreciation, and amortization) in the industry. The average EBITDA margin for Whole Foods during the past three years stood at 9%—three times that of Supervalu’s (3.1%) and almost twice that of Kroger (4.6%).
Competition depresses margins
Although Whole Foods has maintained relatively high margins compared to the industry average, the company’s margins were negatively impacted by increasing competition from mainstream supermarkets in the organic and natural foods market. Additionally, for more than three years, Whole Foods has been working hard to shed its image as an overpriced grocer and has been aiming to offer better deals at lower prices, thereby allowing its margins to contract.
Whole Foods’ net profits stood at $536 million for fiscal 2015, showing a decline of 7.4% from the previous year. The company’s net profits declined by a 4.7% CAGR (compounded annual growth rate) between fiscal 2012 and fiscal 2015.
Fiscal 2016 guidance for sales growth and margins
For fiscal 2016, Whole Foods is looking for a sales growth in the range of 3%–5%. The company is also expecting a decline in its operating margin by 75 basis points, and an EBITDA margin of around 8.5%. Some of the steps that the company plans to take in the coming year to achieve its targets include the following:
- Cost restructuring
- increased focus on exclusive brands
- increased promotional activity
- investments in digital strategies and technology platforms
To read more on the company’s guidance, please refer to Market Realist’s earnings overview series Whole Foods’ Same-Store Sales Fell and Profit Missed Expectations.
