Mutual Funds: A Comparative Analysis Using the Treynor Ratio
The Treynor ratio calculates how much an investment has earned above the risk-free market rate for every unit of risk assumed.
Nov. 19 2015, Updated 10:07 a.m. ET

The Treynor ratio
The Treynor ratio calculates how much an investment has earned above the risk-free market rate for every unit of risk assumed. Although it is similar to the Sharpe ratio, its measure of risk is different. Whereas the Sharpe ratio considers the total risk of the investment, the Treynor ratio only considers the systematic risk, assuming that the non-systematic risk is fully diversified in developing the portfolio. Risk in the Treynor ratio, represented by beta, is the systematic risk or non-diversifiable risk. The equation for the Treynor ratio is as follows:
Treynor ratio = (average return of portfolio – risk-free rate of return)/beta of portfolio
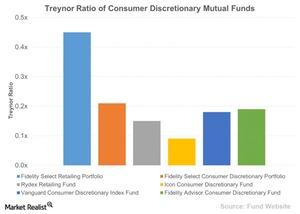
Let’s have a look at the Treynor ratios of our chosen consumer discretionary mutual funds.
Comparison of consumer discretionary mutual funds
The Fidelity Select Retailing Portfolio (FSRPX) has the highest Treynor ratio, 0.45x, which means that the fund has provided a higher return than any of the funds in the group, given the level of systematic risk. Interestingly, the Fidelity Advisor Consumer Discretionary Fund (FCNAX), which had a lower Sharpe ratio than the Vanguard Consumer Discretionary Index Fund (VCDAX), has a higher Treynor ratio due to its lower beta of 0.80.
The Rydex Retailing Fund and its Treynor ratio
The Rydex Retailing Fund (RYRTX) is an open-ended mutual fund and it invests more than 80% of its assets in US retail companies. As of October 31, 2015, it had 73.05% invested in consumer cyclical stocks and 18.9% in consumer defensive stocks. The fund has returned 7.1% in the last year and its Treynor ratio is 0.15x, fifth among the funds we’ve looked at. RYRTX’s top five holdings are Amazon.com (AMZN), The Home Depot (HD),Walmart Stores (WMT), CVS Health (CVS), and Walgreens Boots Alliance (WBA). In the next article, we’ll compare funds based on their Sortino ratios.
