Mutual Funds: A Comparative Analysis Using the Sharpe Ratio
Investors often use the Sharpe ratio to gauge the performance of portfolios of investments.
Nov. 19 2015, Updated 8:10 a.m. ET

The Sharpe ratio
Investors often use the Sharpe ratio to gauge the performance of investment portfolios. The Sharpe ratio measures the units of excess return earned by a portfolio over the risk-free rate for every unit of risk taken. The risk is the standard deviation of the portfolio returns. The equation for the Sharpe ratio is as follows:
Sharpe ratio = (average return of portfolio – risk-free rate of return)/standard deviation of portfolio returns
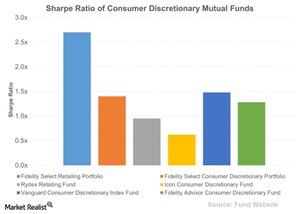
Let’s have a look at the Sharpe ratios of our chosen funds.
Comparison of retail sector mutual funds
The chart above shows that the Fidelity Select Retailing Portfolio (FSRPX) has the highest Sharpe ratio, 2.7x, which indicates that it is able to extract 2.7 units of excess return from every additional unit of risk taken. The standard deviation of FSRPX’s returns is 12.1. The Vanguard Consumer Discretionary Index Fund (VCDAX), which did not generate any alpha, has the second highest Sharpe ratio of 1.5x.
The ICON Consumer Discretionary Fund (ICCAX) had a Sharpe ratio of 0.62, the lowest in the group. However, it is the least risky in terms of volatility, with a score of 11.7, which could attract more risk-averse investors.
Fidelity Select Consumer Discretionary Portfolio
The Fidelity Select Consumer Discretionary Portfolio (FSCPX) is an open-ended mutual fund that aims towards capital appreciation. The fund has returned 14.5% to its investors in the last year and its Sharpe ratio is 1.4, the third highest among the group of funds we’ve looked at. Its top five holdings are Amazon.com (AMZN), The Walt Disney Company (DIS), The Home Depot (HD), Nike (NKE), and Starbucks (SBUX). In the next part of this series, we’ll have a look at the mutual funds’ Treynor ratios.
