Assessing Post Properties’ Average Price-to-FFO Multiple
Post Properties’ TTM price-to-FFO multiple is in line with its historical valuation at around 18.9x.
Dec. 8 2015, Updated 8:05 a.m. ET

Price-to-FFO multiple
The most common way of calculating the relative value of an REIT (real estate investment trust) such as Post Properties (PPS) is price-to-FFO (funds from operations) multiple. A company’s FFO is widely used because it’s the main earnings metric for REITs, comparable to EPS (earnings per share) in other industries. The price-to-FFO multiple metric is equivalent to the PE (price-to-earnings) ratio used in other industries.
Price-to-FFO multiples of peers
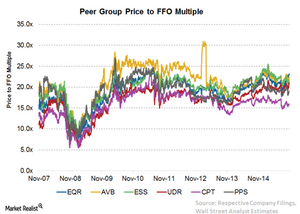
A closer look at Post Properties’ (PPS) trailing twelve-month price-to-FFO multiple shows that the company is in line with its historical valuation. Over the past eight years, Post Properties’ (PPS) price ranged between 7x–27x of its FFO, with a current price-to-FFO multiple of around 18.9x. Post Properties experienced its lowest price-to-FFO multiple in November 2008, whereas the company recorded its highest multiple in May 2010.
At its current multiple (as of November 27), Post Properties’ stock, while lower than some of its major peers, was trading in line with the industry average price-to-FFO multiple. For example, Equity Residential (EQR) has been trading at a price-to-FFO multiple of 23.1x. Meanwhile, AvalonBay Communities (AVB) has been trading at a multiple of 22.5x, and Essex Property Trust (ESS) has been trading at a multiple of 21.7x. The industry average price-to-FFO multiple is 19x.
Why Post Properties has an average multiple
Post Properties’ lower valuation compared to some of its peers—despite the fact that it has been reporting good growth—is due to a number of factors. Although the company has a relatively lower leverage, its high percentage of variable debt exposes it to rises in interest costs, which affects its valuation.
In addition, Post Properties’ lower EBITDA (earnings before interest, taxes, depreciation, and amortization) margin compared to some of its peers also negatively affected its valuation. In addition, Post Properties’ limited exposure to some of the high growth markets, coupled with its high exposure to the moderating markets of Texas and Washington D.C., also affected its recent valuation.
Dividend yields of Post Properties and peers
As of November 27, 2015, Post Properties has offered a dividend yield of 2.85%, which is higher than Equity Residential (EQR), which has offered a dividend yield of 2.70%, AvalonBay Communities (AVB), which has offered a dividend yield of 2.71%, and Essex Property Trust (ESS), whose dividend yield has reached 2.45%. The industry average dividend yield is 2.98%.
Post Properties makes up 0.39% of the holdings of the iShares US Real Estate ETF (IYR).
Continue to the next part of this series for an evaluation of Post Properties’ EV-to-EBITDA multiple.
